View individual results
Where to find them
The competency results appear in the review result of a participation group. Open a completed review and click “Show result”.
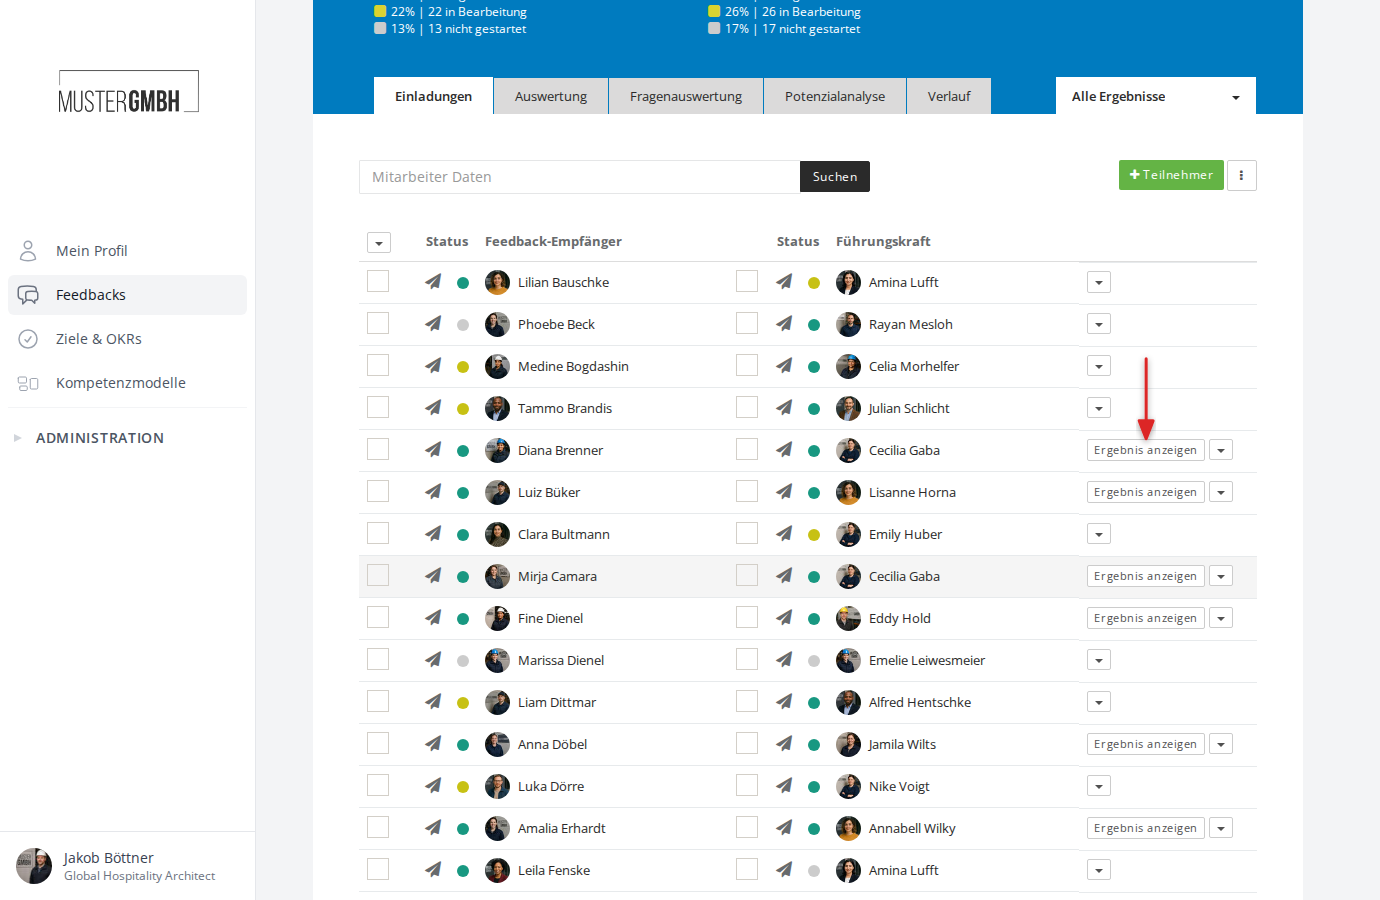
The results are shown in two places on the result page:
- Inside the questionnaire: each competency assessment question shows its results directly below the question (one table per category).
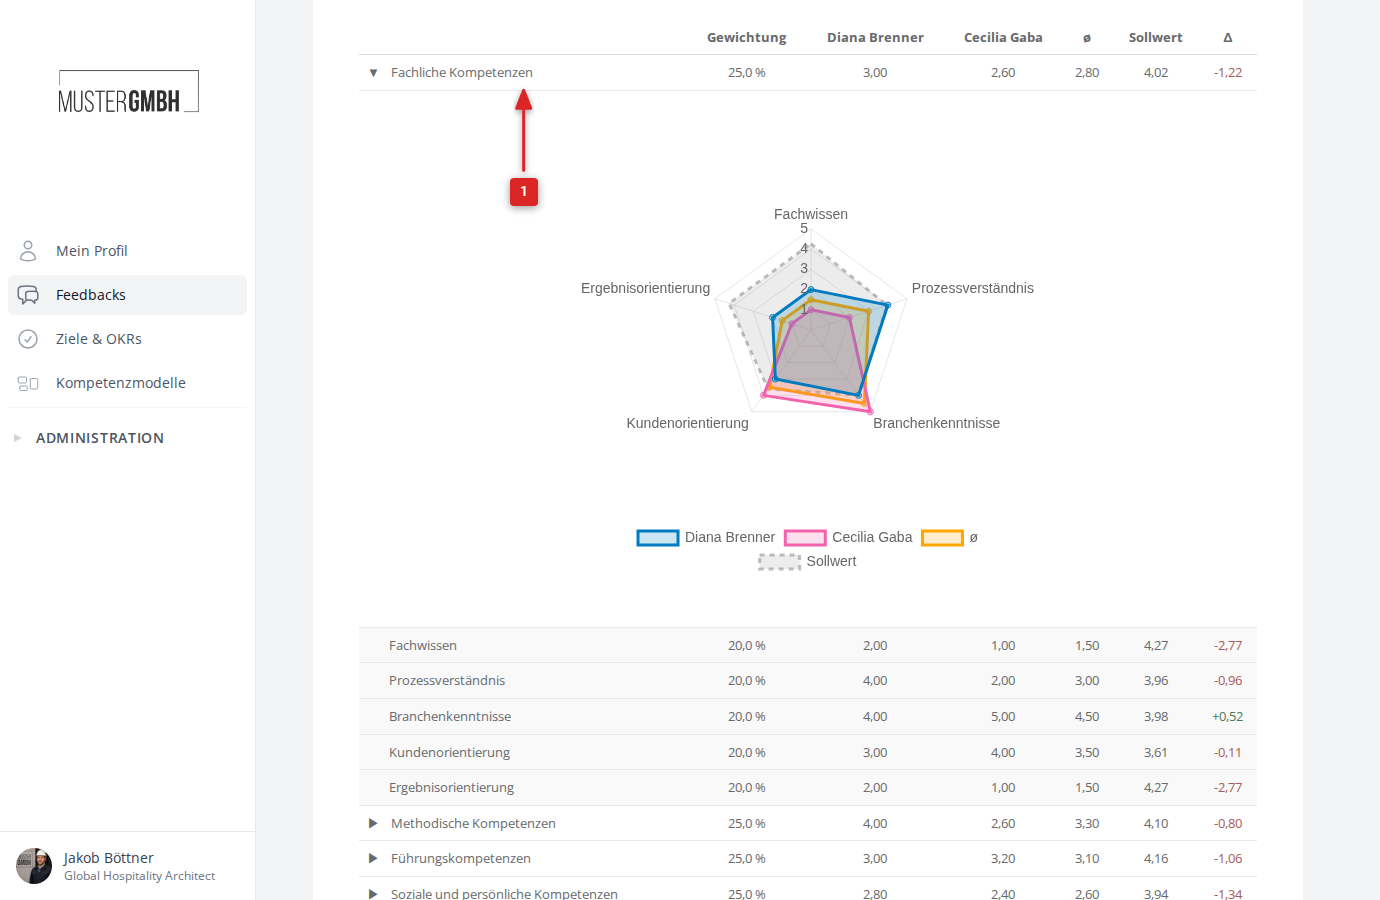
- At the end of the page: a summary “Competency evaluation” section with a radar chart and an expandable result table across all categories.
The results are also included in the review’s PDF export.
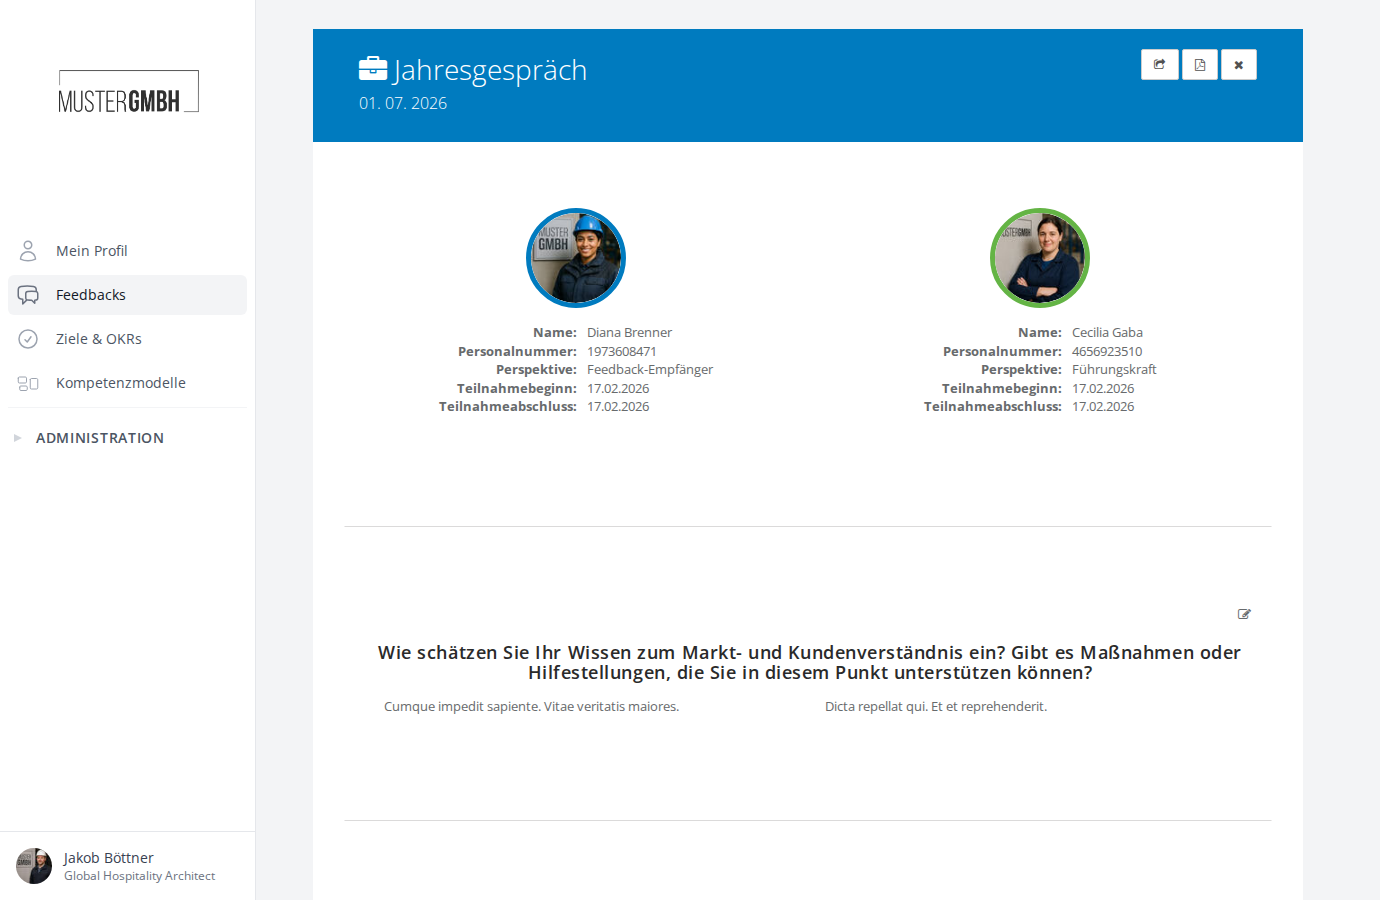
Competency assessment per question
Inside the questionnaire, the results of each competency assessment question are shown directly. The section is titled “Competency assessment” and shows the assigned job profile. There are two display modes:
Compact display (default)
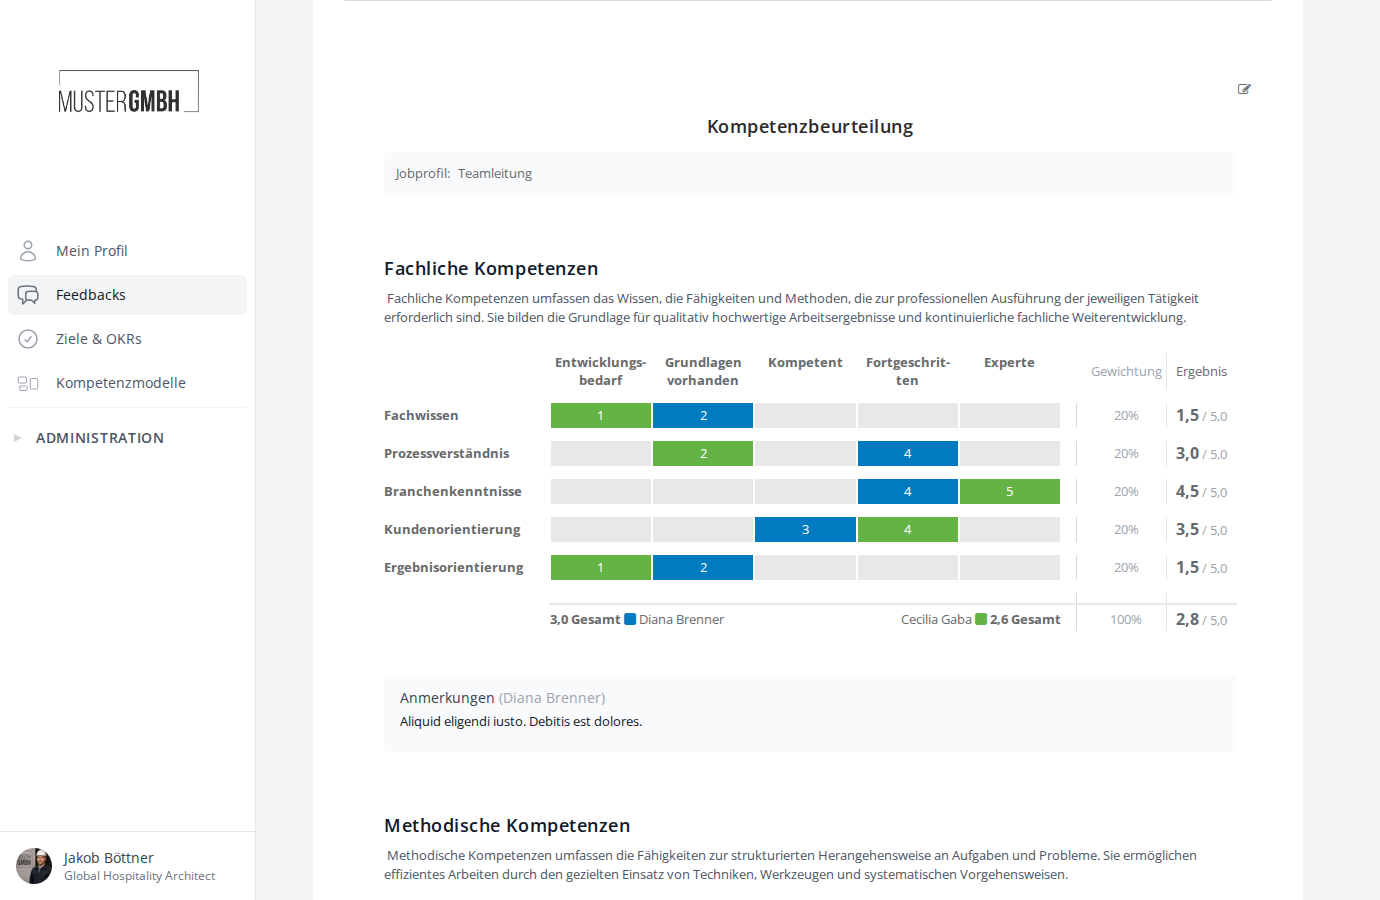
In compact mode, all competencies of a category are shown in a matrix table:
- The header row contains the scale values (e.g. “Development needed”, “Basics in place”, “Competent”, “Advanced”, “Expert”) as columns.
- Each row stands for one competency.
- The participants’ ratings are shown as color-coded bars. The color of the feedback recipient differs from that of the feedback givers.
- The “Weight” column shows the competency’s percentage weight within the category.
- The “Result” column shows the average rating value (e.g. “2.8 / 5.0”).
- At the end of each category, a summary row shows the totals per participant and the overall category value.
Above the table, a category description appears if one is stored in the competency model.
Expanded display
In expanded mode, each competency is shown as its own block:
- Every competency appears with its own title and an optional description.
- The rating scale is shown as a separate table per competency.
- Weight and result appear to the right of the scale.
- At the end of the category, a color-coded summary appears with color squares for self-assessment and external assessment.
Free-text competencies
When free-text (write-in) competencies are enabled for a category, additional competencies inserted by participants appear on a light-blue background. They are shown in italics and feed into the category rating.
Notes
Below each category, participants’ notes may appear if they recorded any while filling in the review. With multiple participants, each name is shown in parentheses.
Summary competency evaluation
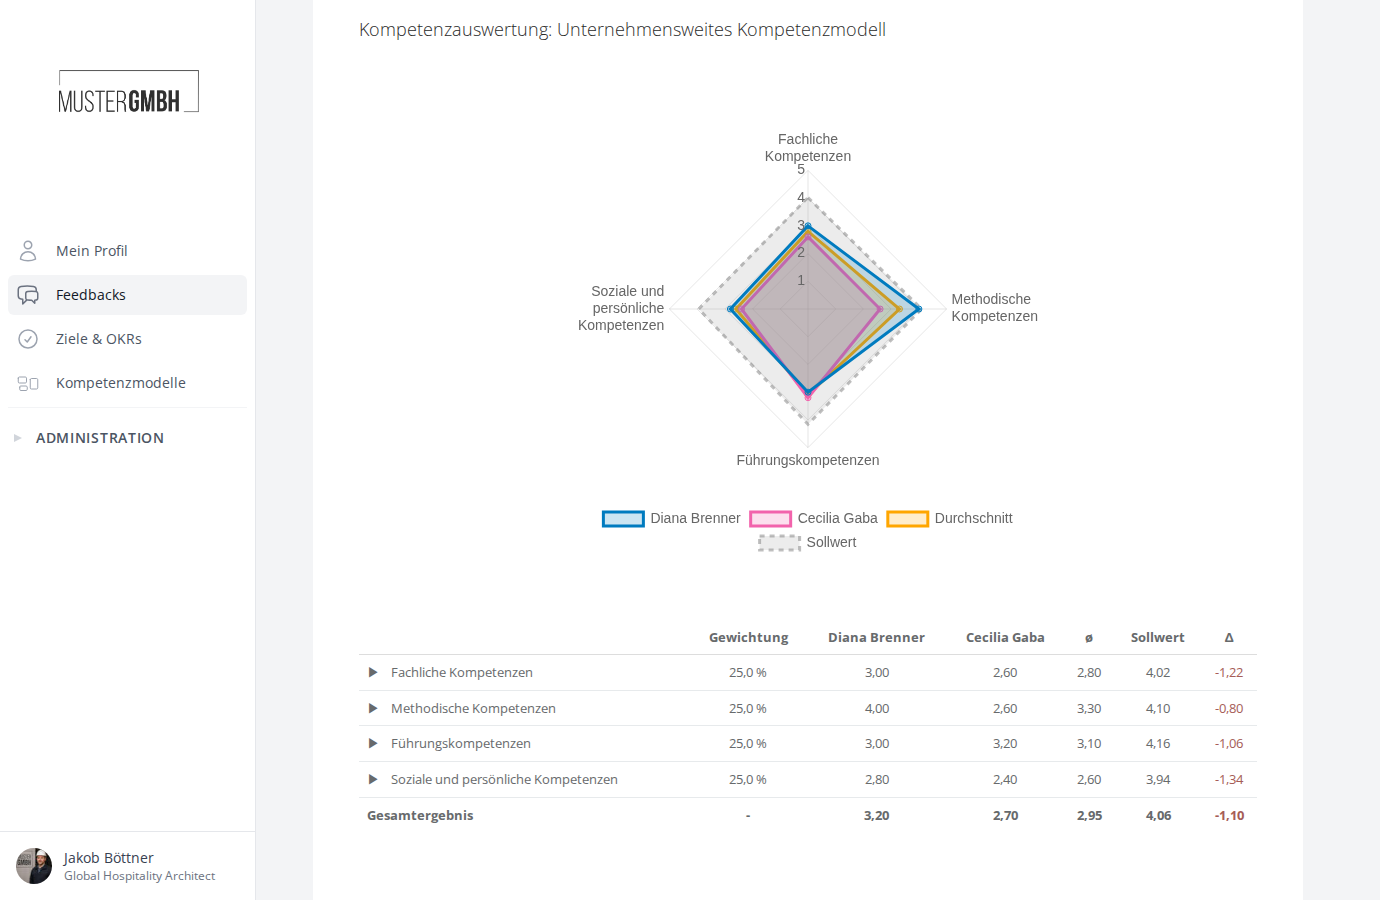
At the end of the result page, the “Competency evaluation: [name of the competency model]” section appears. It summarizes all ratings across all categories.
Radar chart
When at least three competency categories exist, a radar chart is shown:
- Axes: each axis is one competency category.
- Data sets (lines): depending on how the review is configured:
- One line per participant: shows each participant’s individual ratings, labeled with their name.
- One line per perspective: groups the results by perspective (e.g. “Manager”, “Peers”). The lines appear in the respective perspective color.
- Consolidated display: a single line when anonymization is set to “No name”.
- Target value (optional): a dashed gray reference line showing the desired target value per category. It is only shown when “Show target values” is enabled for the revision and target values are stored in the job profile.
- Average line (optional): an additional line showing the average across all participants. It is only shown when the corresponding option is enabled for the revision.
Result table
Below the radar chart, a result table is shown:
Table columns:
| Column | Description |
|---|---|
| Weight | Percentage share of the category/competency in the overall result |
| Participants/perspectives | One column per participant or perspective with its rating value |
| ø (average) | Average across all ratings (omitted in consolidated display) |
| Target value | Target value from the job profile (only with target values enabled) |
| Δ (delta) | Difference between average and target value (only with target values enabled) |
Expandable categories:
- Click a category row (▶) to reveal the individual competencies.
- The category row shows the aggregated values per category.
- When expanded, you see:
- A category radar chart (when the category has more than 2 competencies)
- The individual competencies with their rating values
- Free-text competencies on a light-blue background (italic)
Overall result row:
At the end of the table, an overall result row summarizes the weighted average of all categories.
Optional features
The following features can be configured in the competency model’s revision and in the job profile:
| Feature | Configuration | Description |
|---|---|---|
| Target values | Revision: “Show target values” + job profile: target value per category | Shows the target value as a dashed line in the radar and as a column in the table |
| Delta (Δ) | Shown automatically when target values are active | Difference between actual average and target value |
| Average line | Revision: “Average perspective” | Additional average line in the radar chart |
| ”Not applicable” option | Category configuration in the revision | Participants can select “not applicable” for individual competencies |
| Free-text competencies | Category configuration in the revision | Participants can add and rate their own competencies |
PDF export
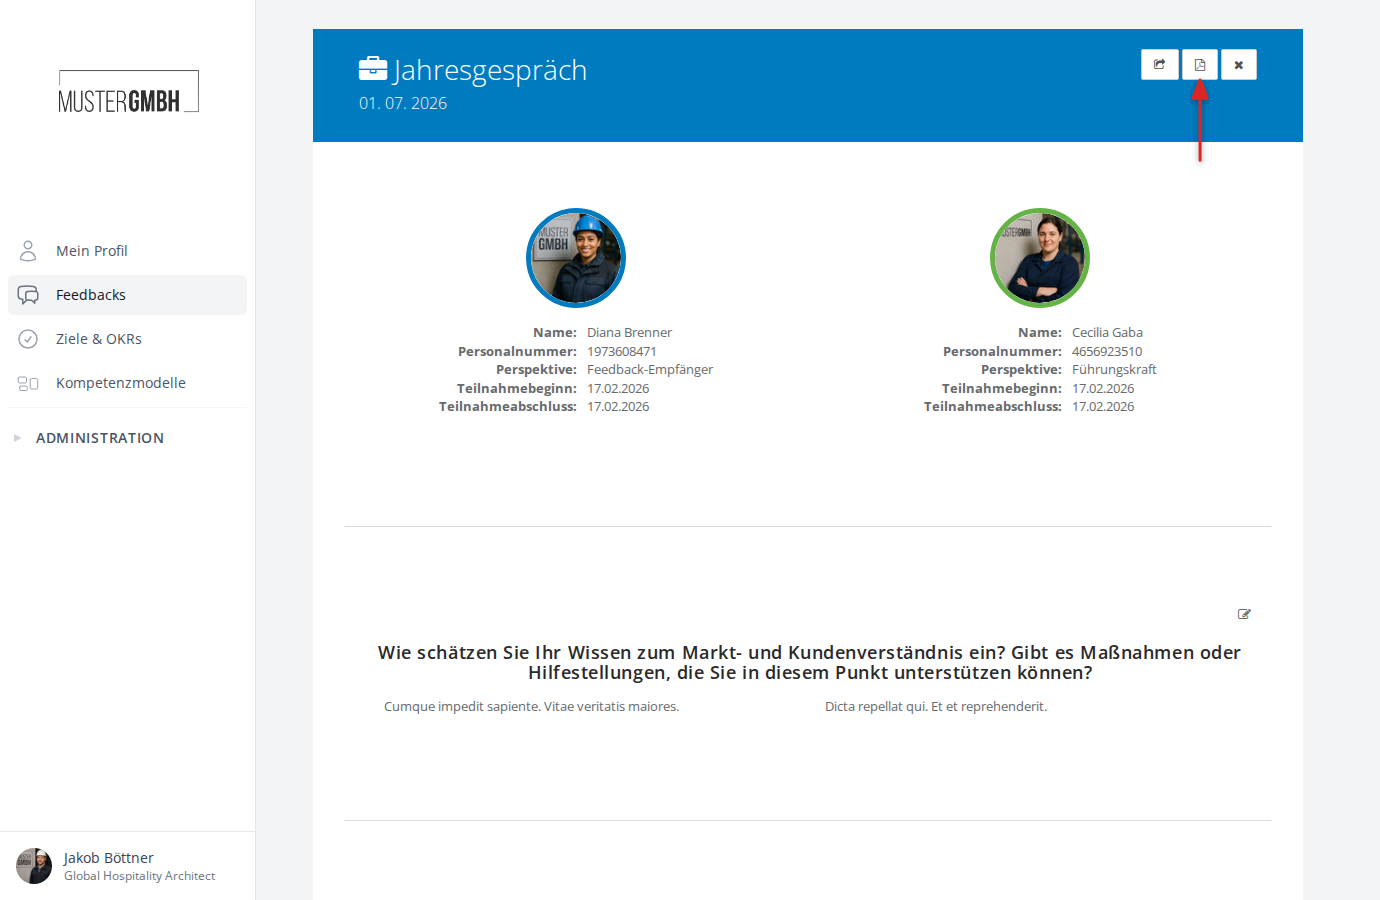
The competency evaluation is included in the review’s PDF export. Click the PDF icon in the header of the result page to download it.
Related articles
- Manage revisions — configure target values, average line and scales
- Job profiles and assignments — set target values and weights per job profile
- Results overview & data export — overall results across all employees
- Add a competency assessment to the questionnaire — add a competency question to the questionnaire
- Create and configure a competency model — define categories and competencies