Results overview & data export
Where to find the overview
The results overview lives inside a competency model, on its revision page:
- In the sidebar, click Competency models.
- Select the competency model you want.
- You land on the revision page. If needed, use the dropdown at the top right to pick the revision you want.
- Click the Overview tab.
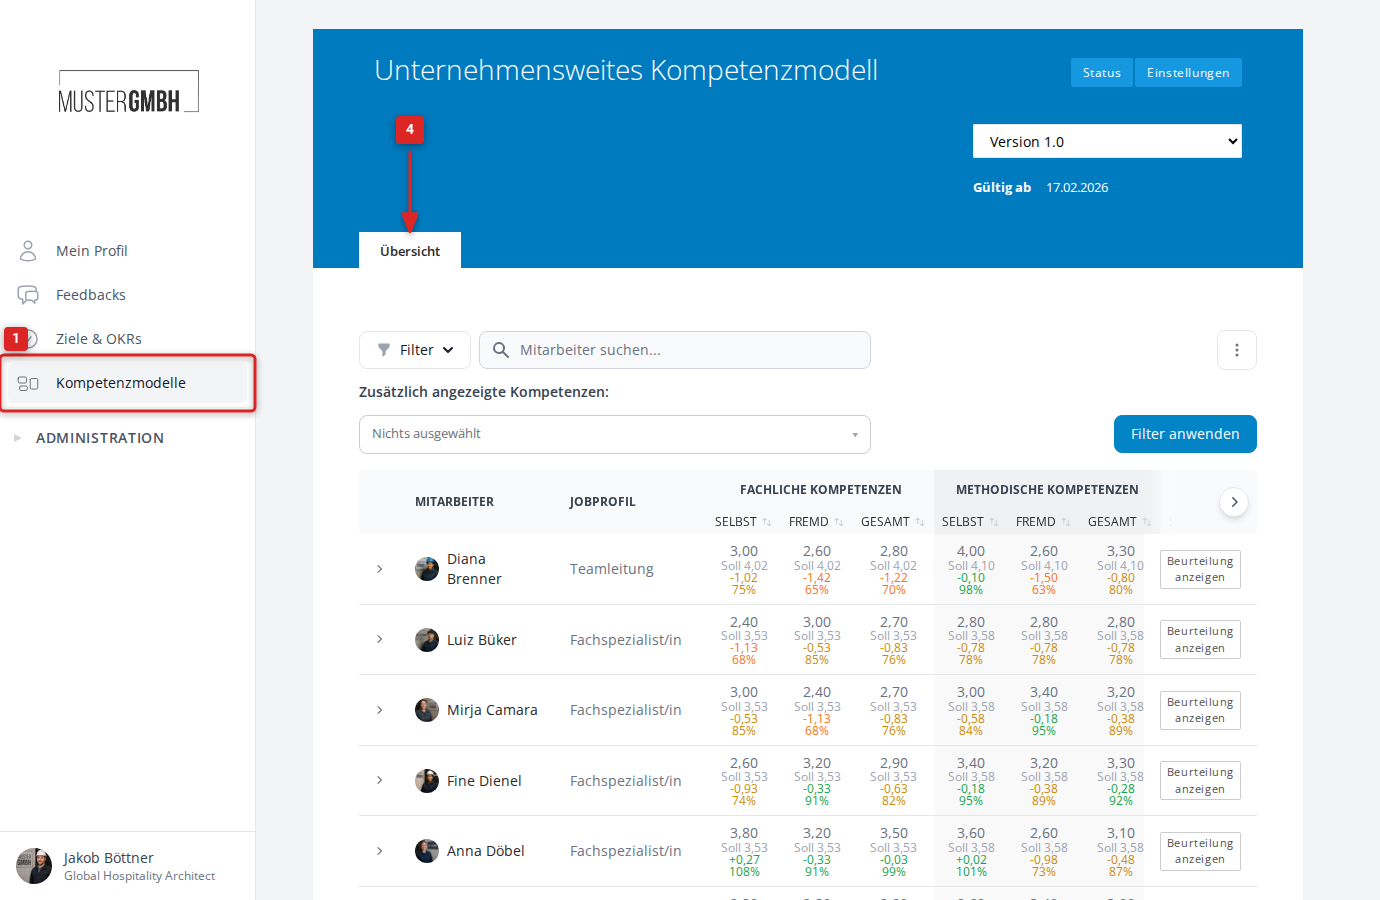
The overview loads as its own tab on the revision page and shows a tabular summary of every competency assessment.
The overview table
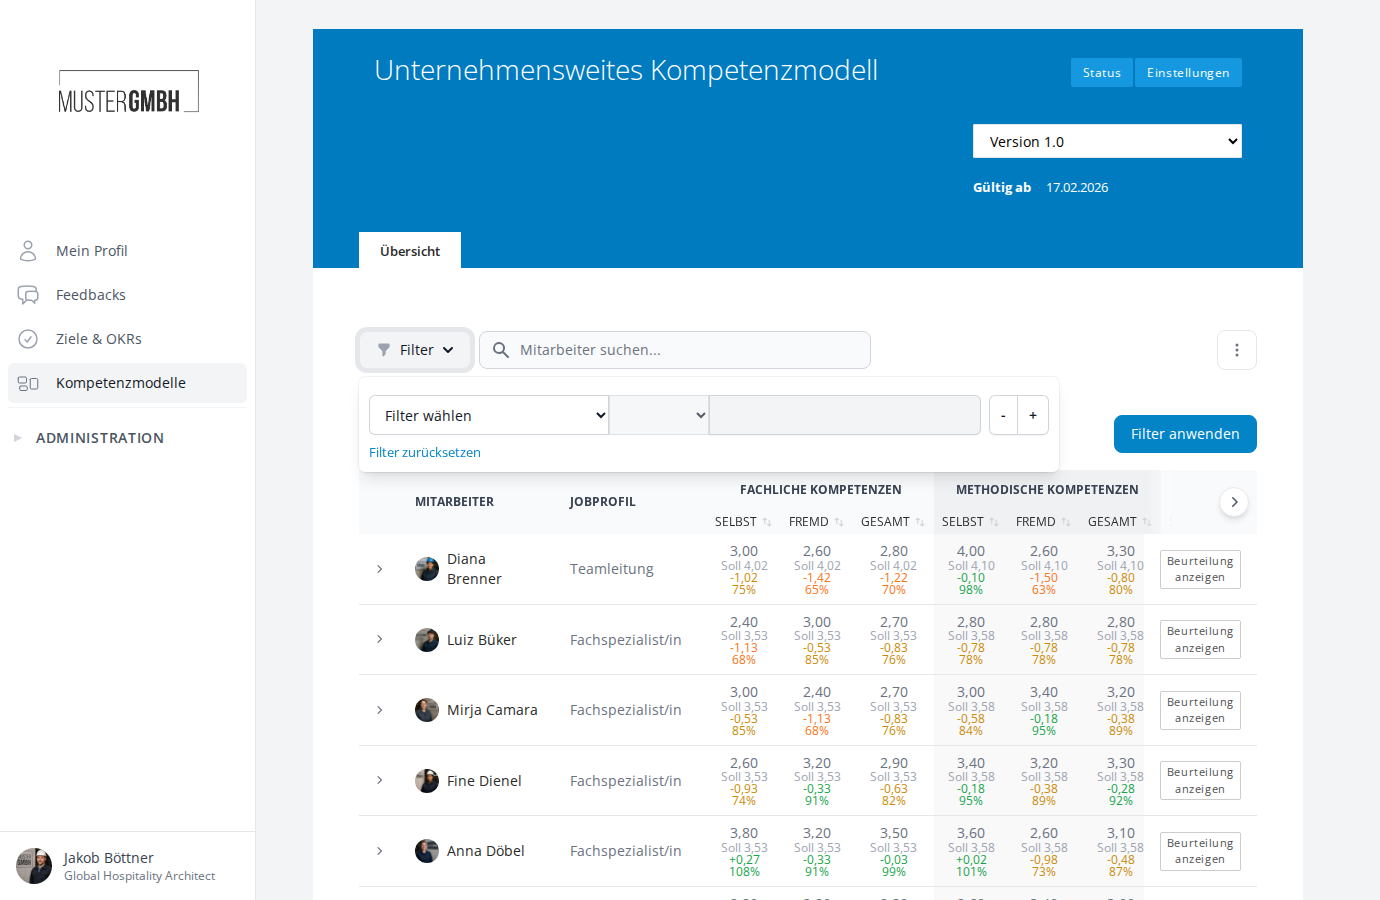
The table shows every assessed employee at a glance. Each row is one person with their aggregated competency values.
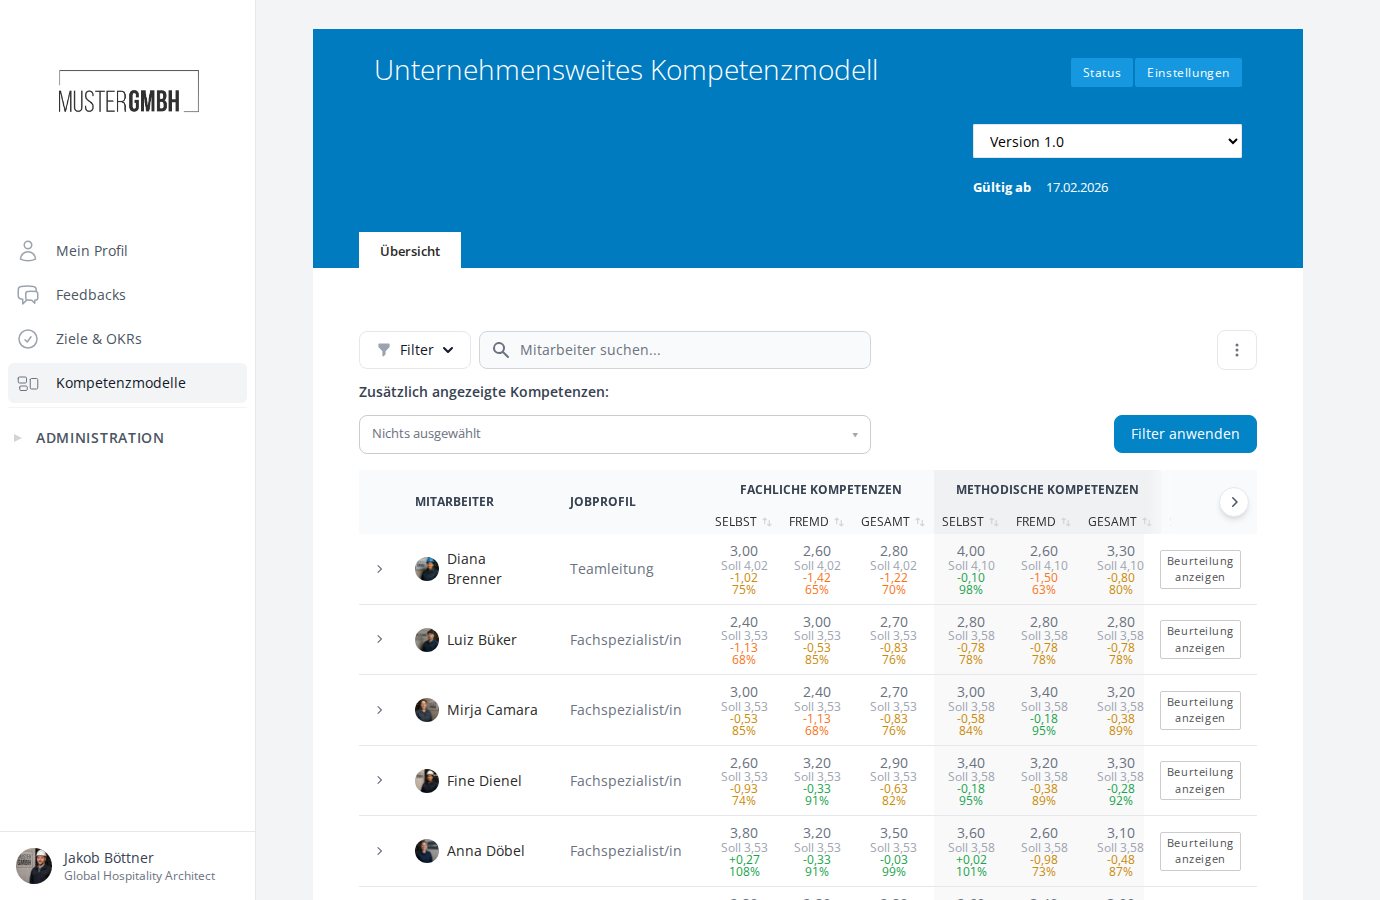
Columns
The table has the following column groups:
- Employee — the employee’s name (linked to their profile)
- Job profile — the assigned job profile
- Per competency category (e.g. “Technical competencies”, “Methodological competencies”) — each split into three sub-columns:
- Self — average of the self-assessments
- External — average of the external assessments
- Overall — the weighted overall value
- Overall — the value weighted across all categories, again split into Self / External / Overall
If the table has more columns than fit on screen, scroll horizontally or use the arrow buttons at the right edge of the table.
Target-vs-actual comparison
When target values are enabled for the revision, each value also shows:
- Target — the target value from the assigned job profile
- Difference — the deviation from the target (e.g. “-1.82” or “+0.04”)
- Percent — the degree of goal attainment as a percentage
If no target values are set, the scale’s maximum is shown instead (labeled max).
The percentages are color-coded:
- Red — below 50%
- Orange — 50% to below 70%
- Yellow — 70% to below 90%
- Green — 90% and above
Expandable detail row
Each row can be expanded with the arrow button on the left. The detail view shows the individual value of every competency, grouped by category:
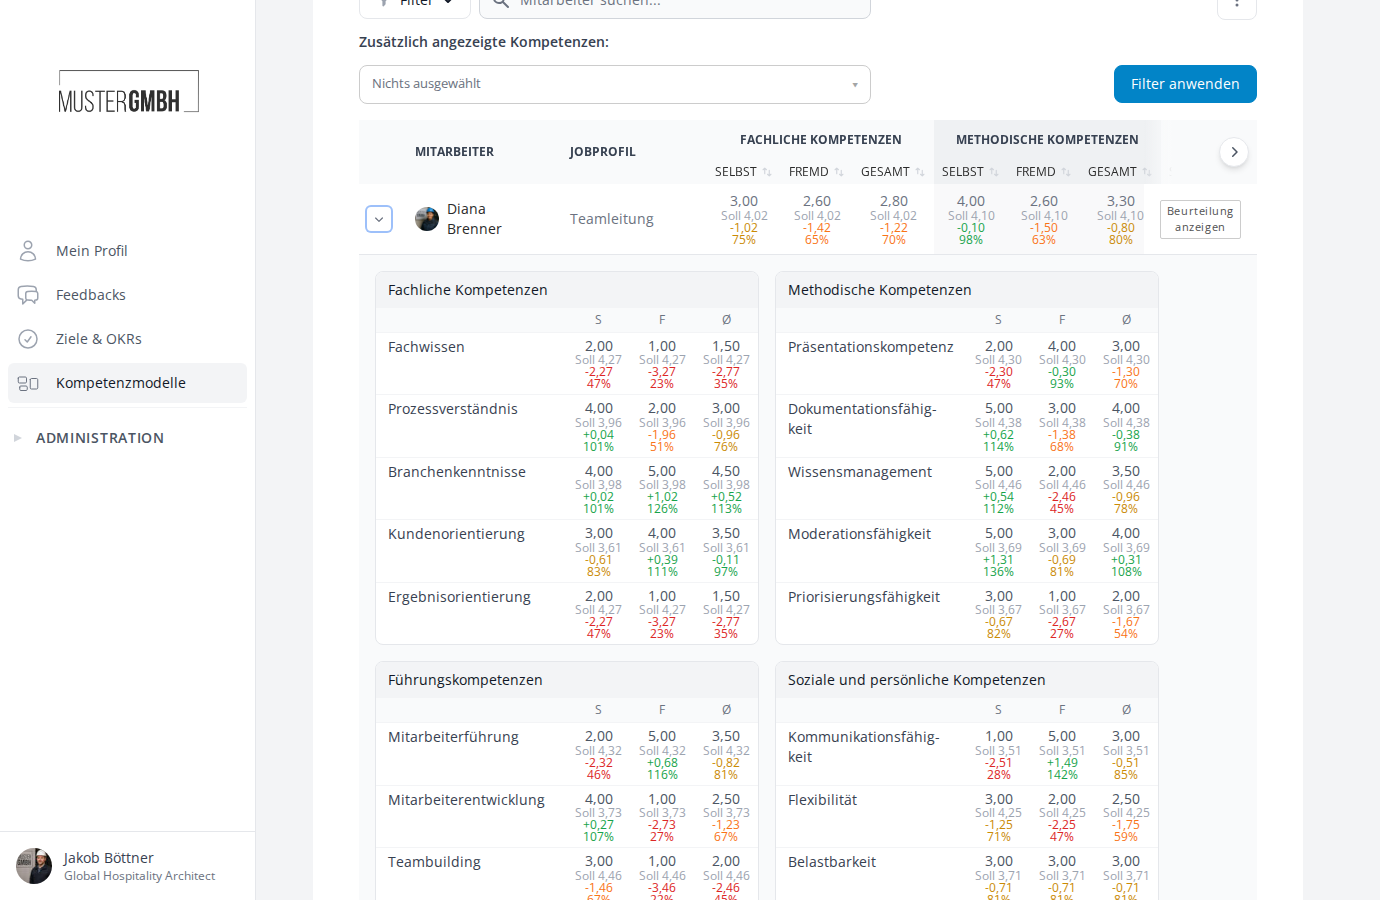
Each competency category is shown as a card with:
- The individual competencies as rows
- The columns S (Self), E (External) and Ø (Overall)
- The matching target-vs-actual values
The Show assessment button at the right of the row takes you straight to the participation group so you can see the full results.
Additional competency columns
By default, the table shows only category values as columns. You can add individual competencies as extra columns:
- Click the “Additionally displayed competencies” dropdown below the search bar.
- Select the competencies you want from the list. They are grouped by category (e.g. “Technical competencies > Technical knowledge”).
- Use the search field inside the dropdown to find a specific competency quickly, or the All / None buttons to select in bulk.
- Click Done, then Apply filter.
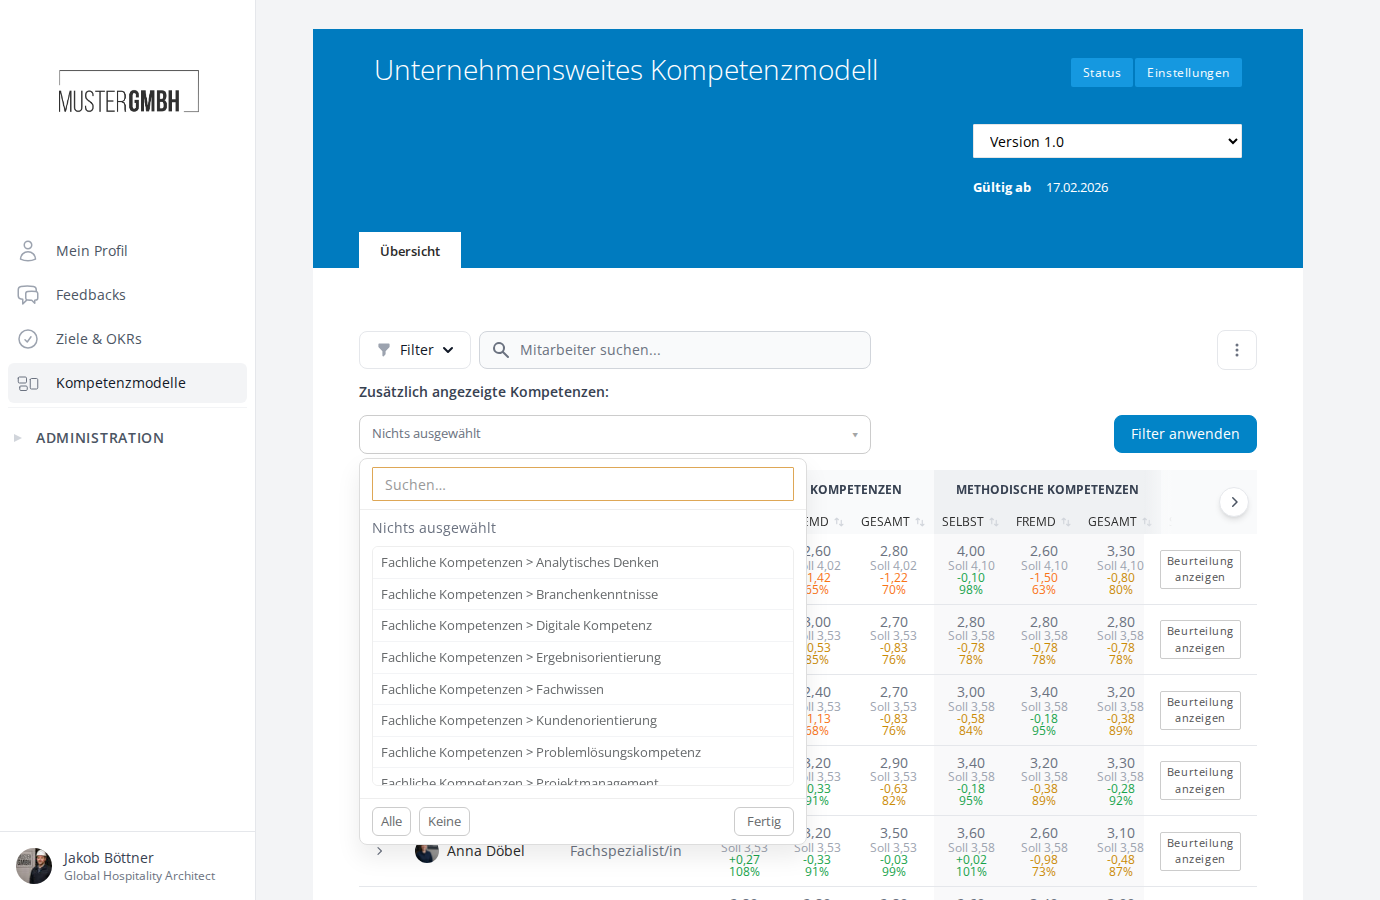
The selected competencies appear as additional column groups, each with the Self / External / Overall sub-columns.
Pagination
The table shows up to 50 entries per page. With more than 50 employees, a page navigation appears at the bottom to switch between pages.
Filtering and sorting
Text search
Use the “Search employees…” field to search the table by name, email address, staff number or job profile name. Type your search term and click Apply filter.
Filters
Click the Filter button to open the filter bar. The “Choose filter” dropdown offers these filter categories:
General filters:
- Job profile — filter by assigned job profile
- Supervisor — filter by supervisor
- Groups — filter by user groups
If your organization has custom fields for employees, they are available as filters too.
Competency scores:
- Competency self / others / overall — filter by the value of a specific competency (first pick the competency, then the value range)
- Competency actual vs. target diff. — filter by a competency’s deviation from its target value
- Competency actual vs. target % — filter by a competency’s degree of goal attainment in percent
Competency category scores:
- Competency category self / others / overall — filter by a category’s value
- Competency category actual vs. target diff. — filter by a category’s deviation from its target value
- Competency category actual vs. target % — filter by a category’s degree of goal attainment
Overall-value filters:
- Overall self score / Overall others score / Overall ø — filter by the total value
- Overall actual vs. target diff. — filter by the total’s deviation
- Overall ACTUAL/TARGET % — filter by the total’s degree of goal attainment
Sorting
Sort the table by clicking the column headers:
- Click Self, External or Overall within a competency category or the overall column to sort by that value.
- Clicking again toggles between ascending and descending order. The current direction is shown by an arrow icon.
Data export (XLSX)
You can export the overview as an Excel file:
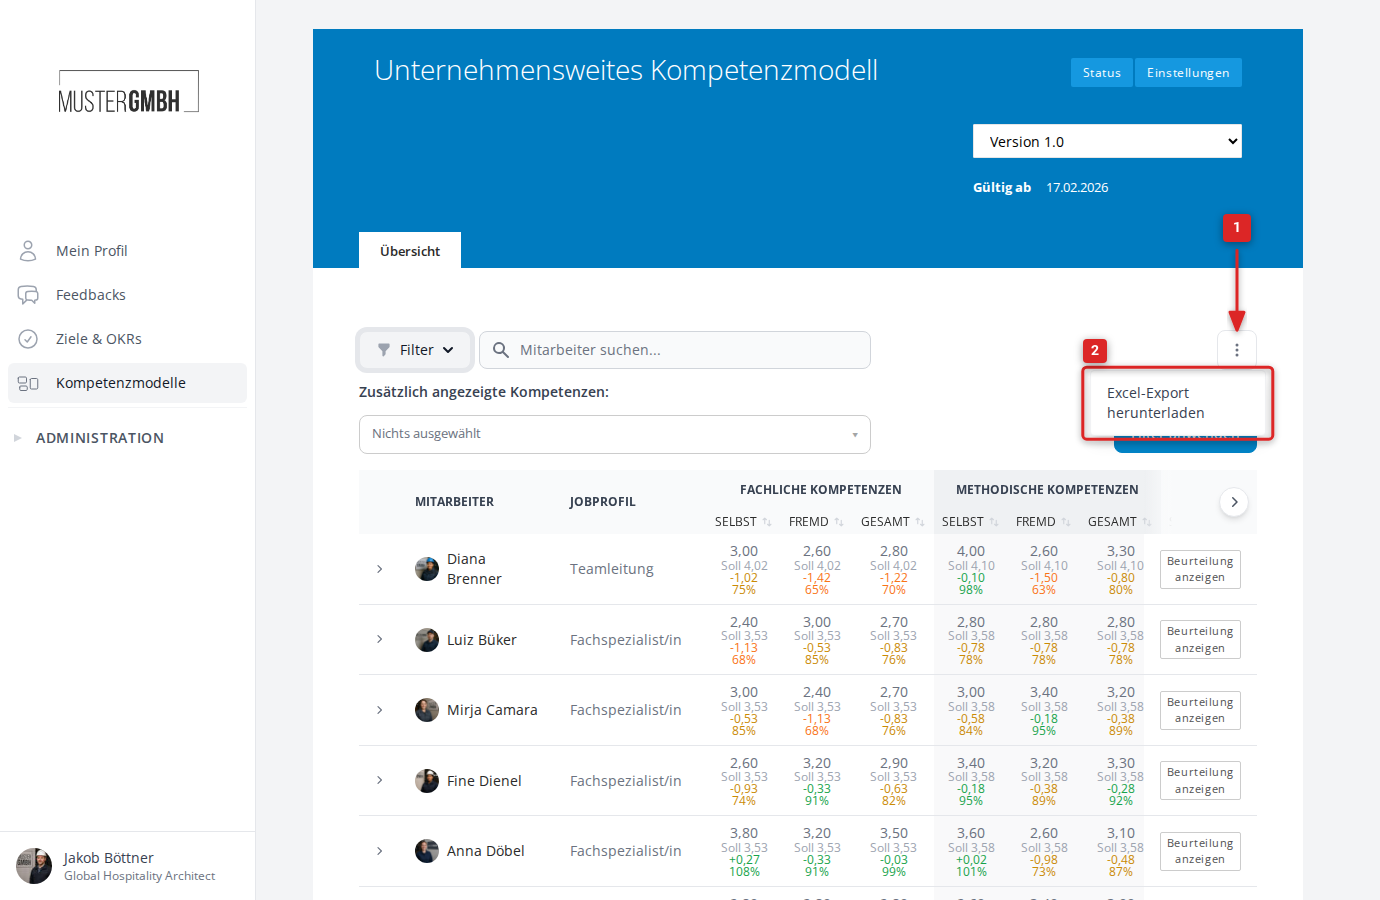
- Click the three-dot menu (⋮) to the right of the search field.
- Select “Download Excel export”.
The exported XLSX file contains:
- All competency categories with the Self / External / Overall sub-columns
- All individual competencies with the Self / External / Overall sub-columns
- Grouped column headers for easy orientation
The export is ideal for further analysis in Excel or another spreadsheet program.
What data is included
The following rules apply to the results:
- Only completed participations are included.
- If sealing is enabled, only sealed results are counted.
- Per employee, the most recent assessment is used, based on the end date of the relevant feedback edition.
- Data visibility follows the permissions of the signed-in user. Only participation groups you have access to are shown.
Related articles
- View individual results — detailed results per participation group
- Manage revisions — adjust the revision configuration
- Job profiles and assignments — manage weights and target values
- Overview — back to the competency model’s overall summary