360° feedback: evaluation
The “Evaluation” tab on a 360° feedback’s status page shows the aggregated results of all participants per question. Here you see at a glance how the answers are distributed across all feedback groups.
Open the evaluation
- In the sidebar, click Feedbacks.
- Open the 360° feedback you want.
- Click the Evaluation tab.
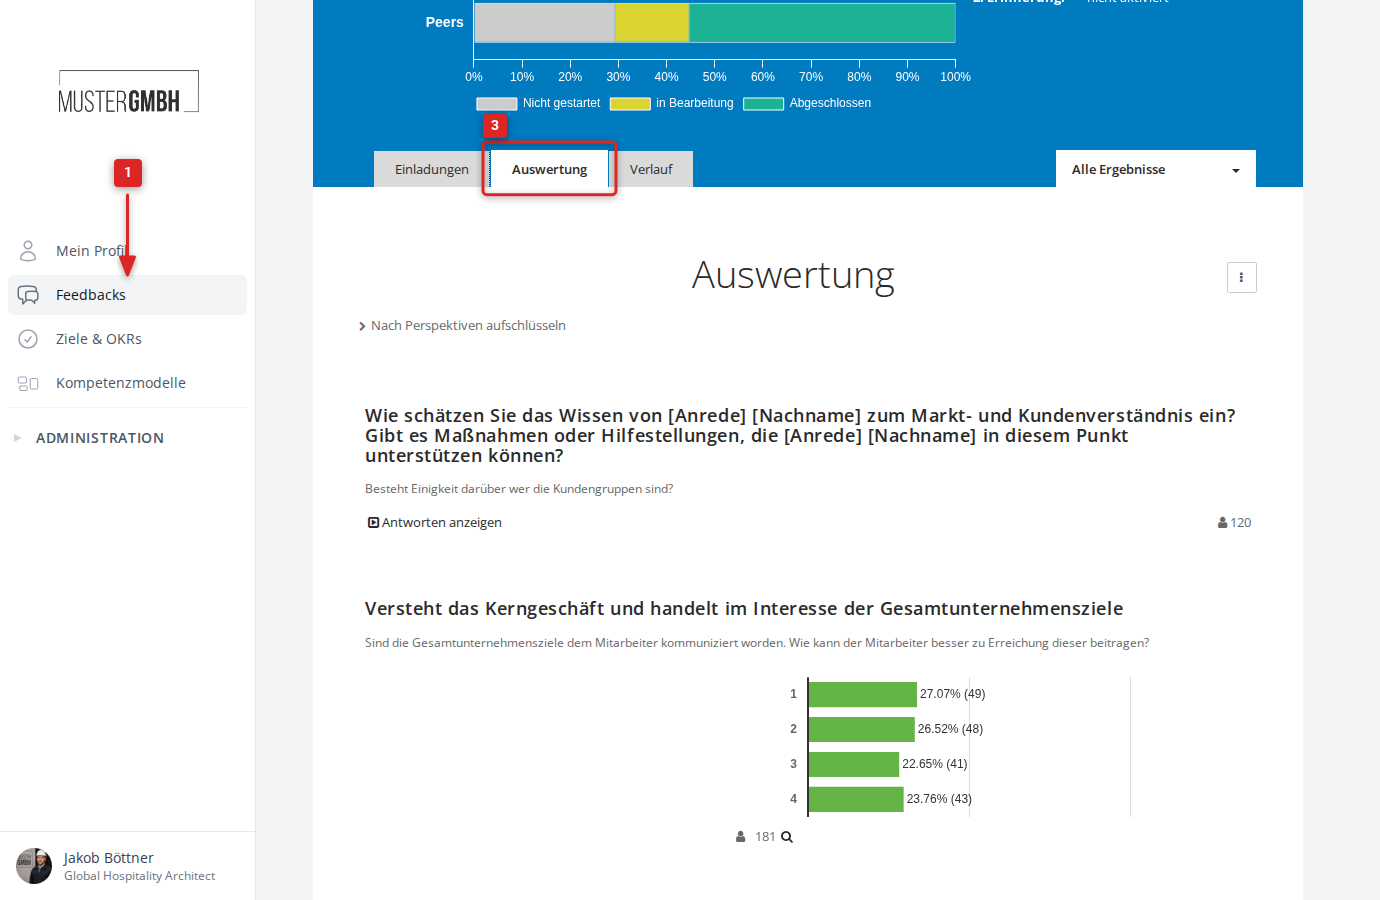
The evaluation shows the results of all questions from the questionnaire.
Presentation by question type
Results are presented differently depending on the question type.
Text questions
For text questions, you first see only the question and the number of answers. Click Show answers to expand the individual answers.
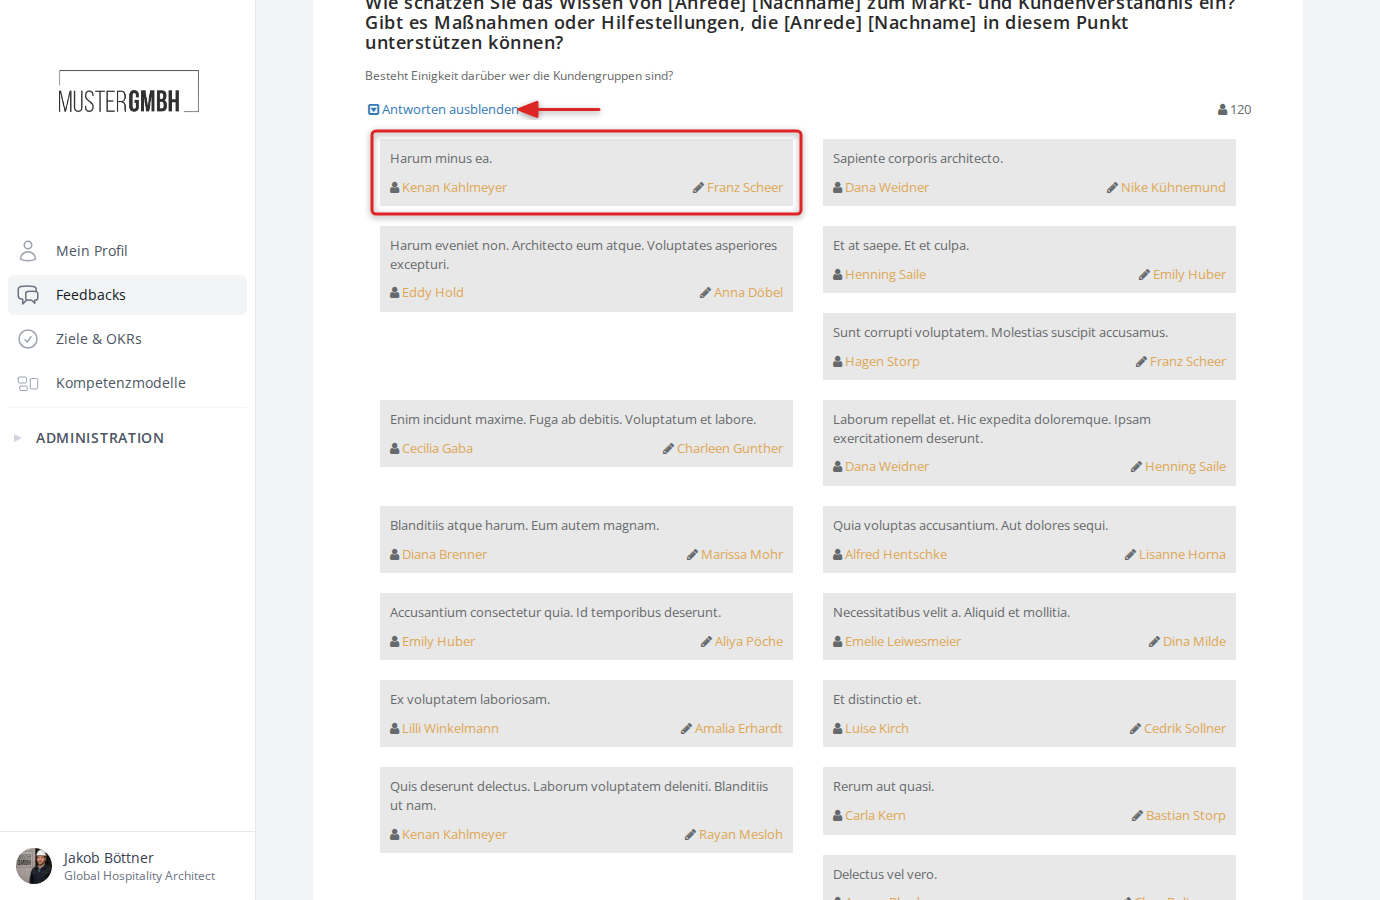
Each answer is shown as a card. The card contains the answer text, the name of the feedback recipient, and (for non-anonymous feedbacks) the name of the feedback giver. Click Hide answers to collapse the answers again.
Rating questions
For rating questions (rating, multiple choice, scales), results are shown as horizontal bar charts.
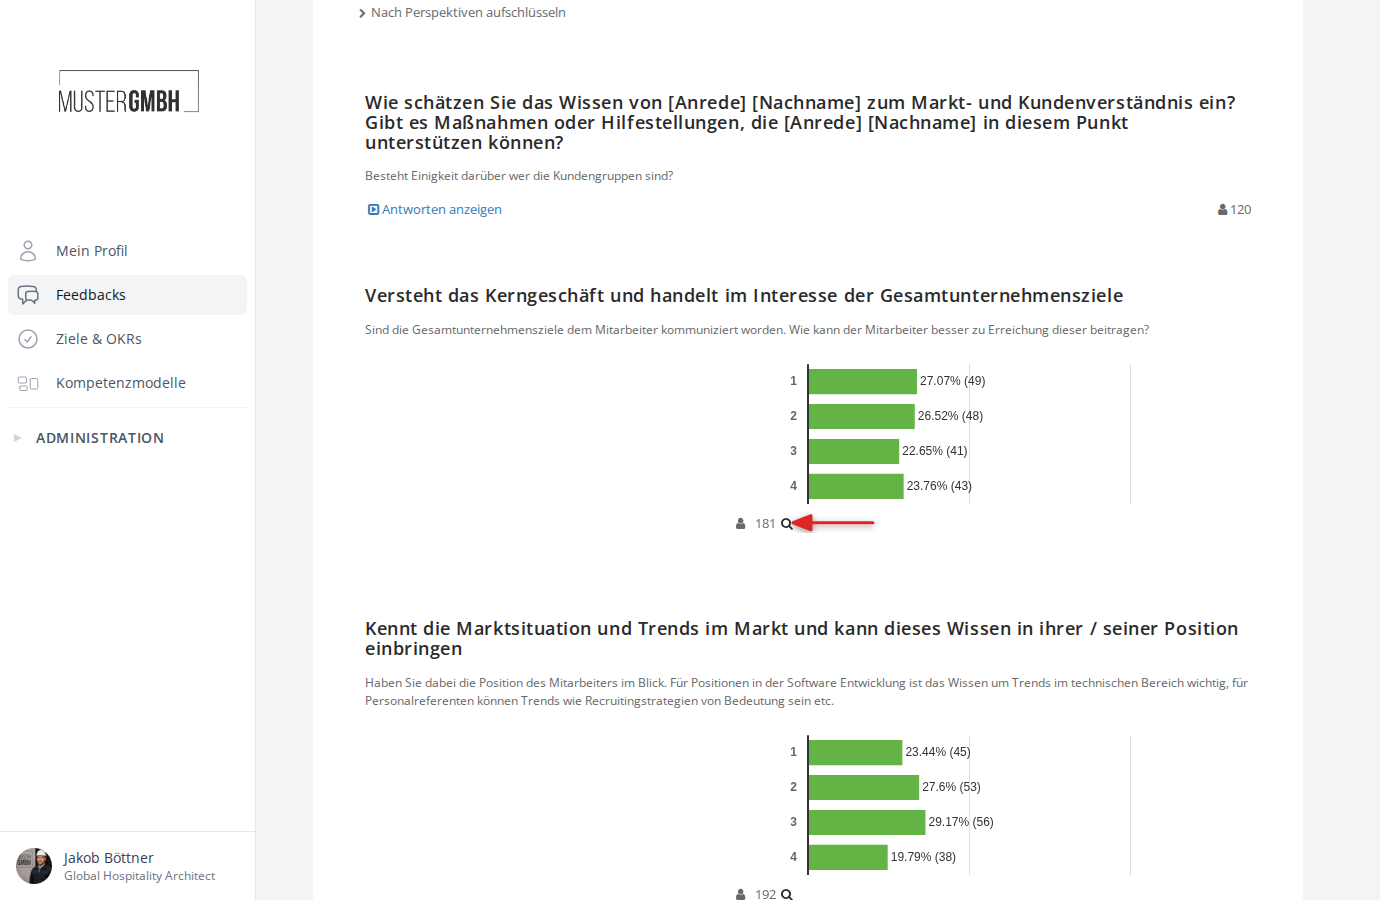
Each answer option appears as its own bar. To the right of the bar are the percentage share and the absolute number of answers in parentheses. Below the chart, the total number of answers is shown.
Detail view (answer inspector)
Click the magnifying-glass icon next to the answer count to open the answer inspector. For each answer option, it shows which feedback recipients received that rating.
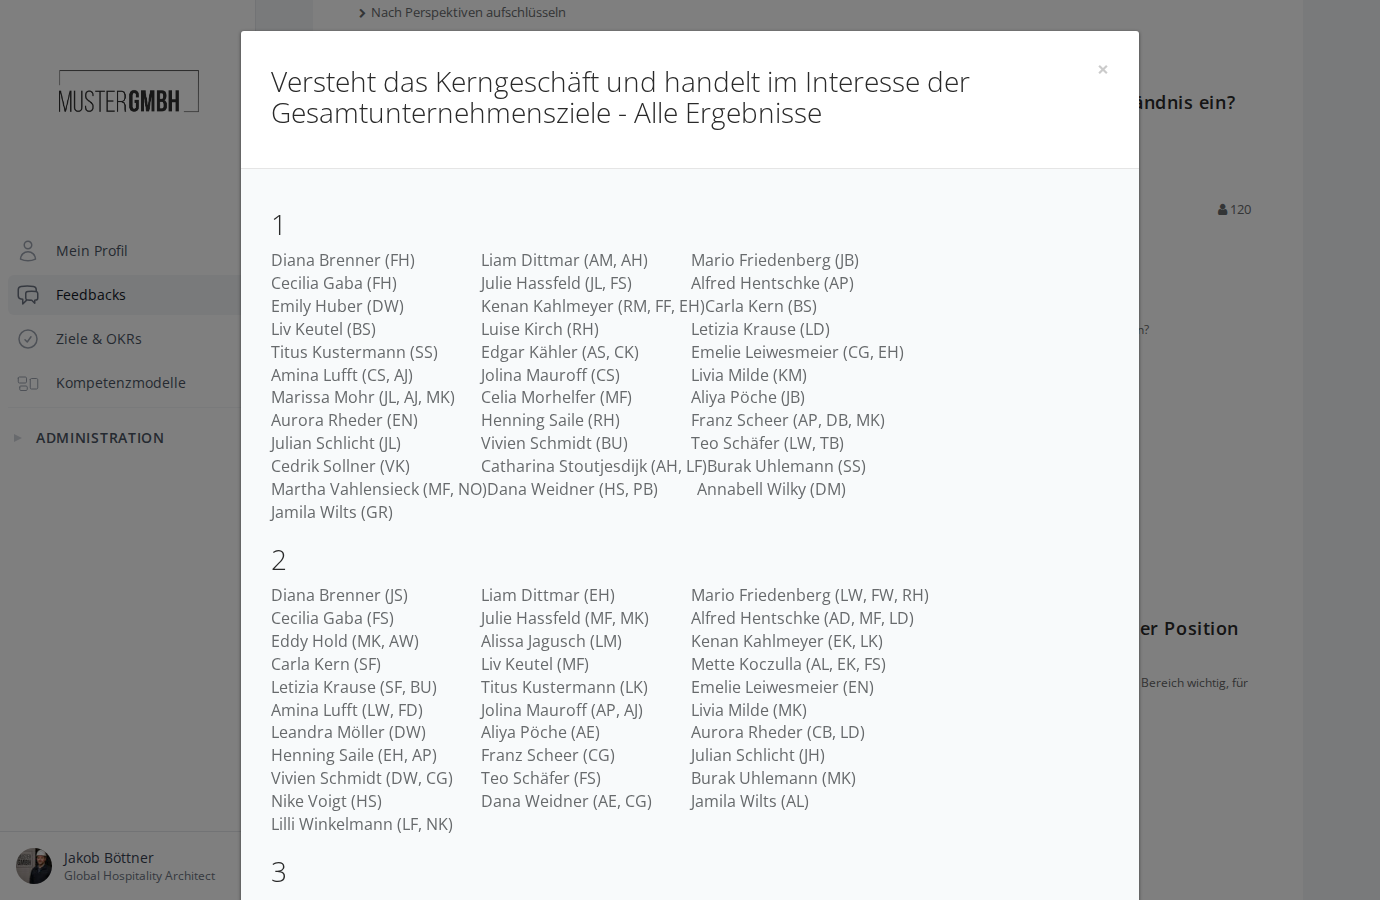
For each answer option, the feedback recipients are listed. In parentheses are the initials of the feedback givers who gave that rating. With more than three feedback givers, the count is shown instead.
Break down by perspectives
For 360° feedbacks with several perspectives (for example, Managers, Peers, Cross-Team), you can show the results separated by perspective. To do so, click Break down by perspectives below the “Evaluation” heading.
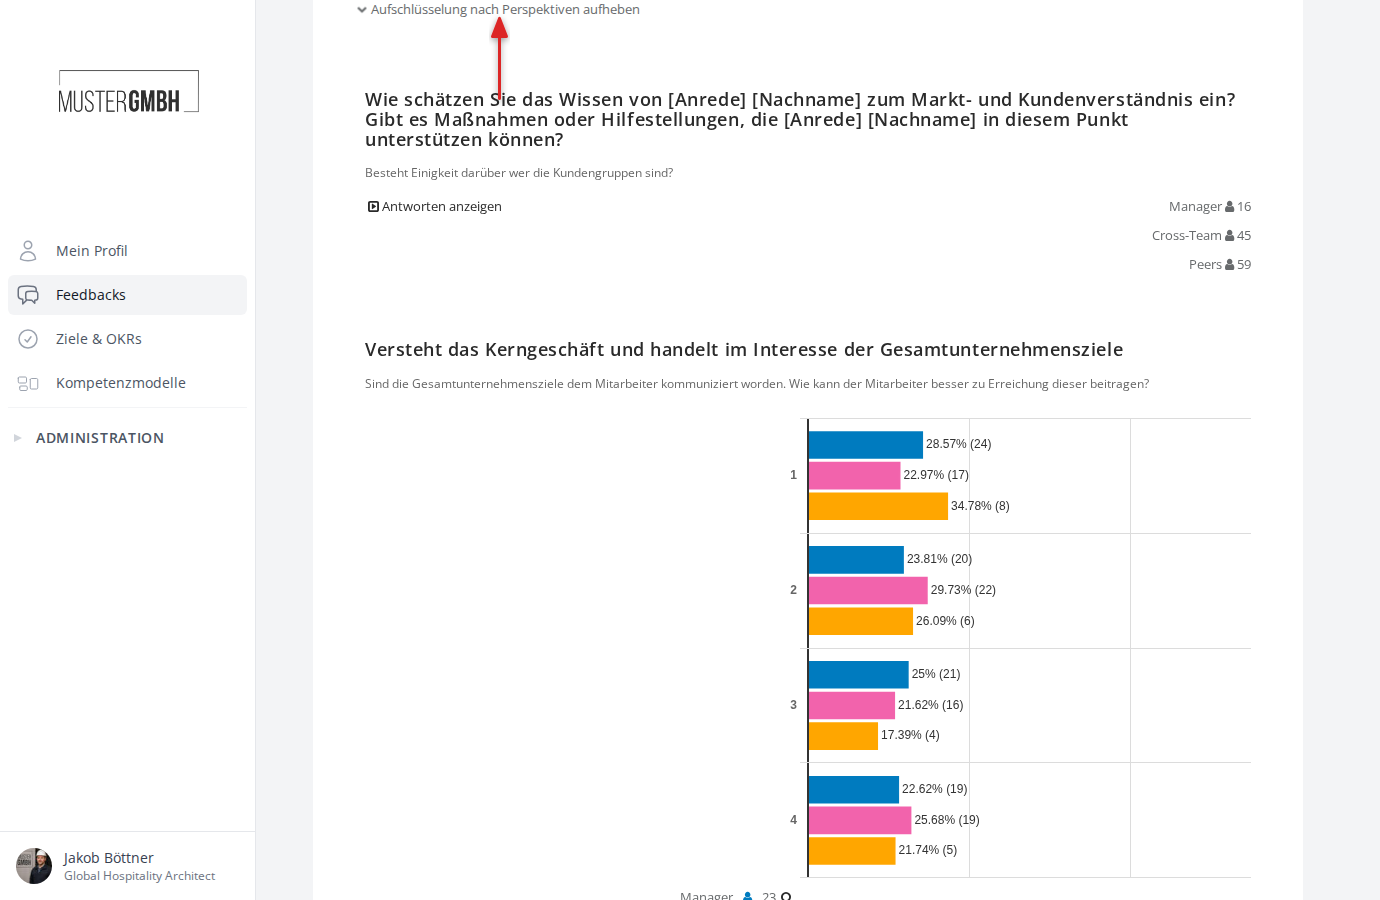
The bar charts then show a separate, color-coded bar for each perspective. This lets you spot differences in rating between the various feedback-giver groups. Click Remove breakdown by perspectives to return to the overall view.
Drill-down analysis
With the drill-down analysis you can break down the results by a custom field, for example by department or location.
- Click the three-dot menu (⋮) to the right of the “Evaluation” heading.
- Choose Drill-down analysis.
- Choose an evaluation dimension from the dropdown.
- Click Show.
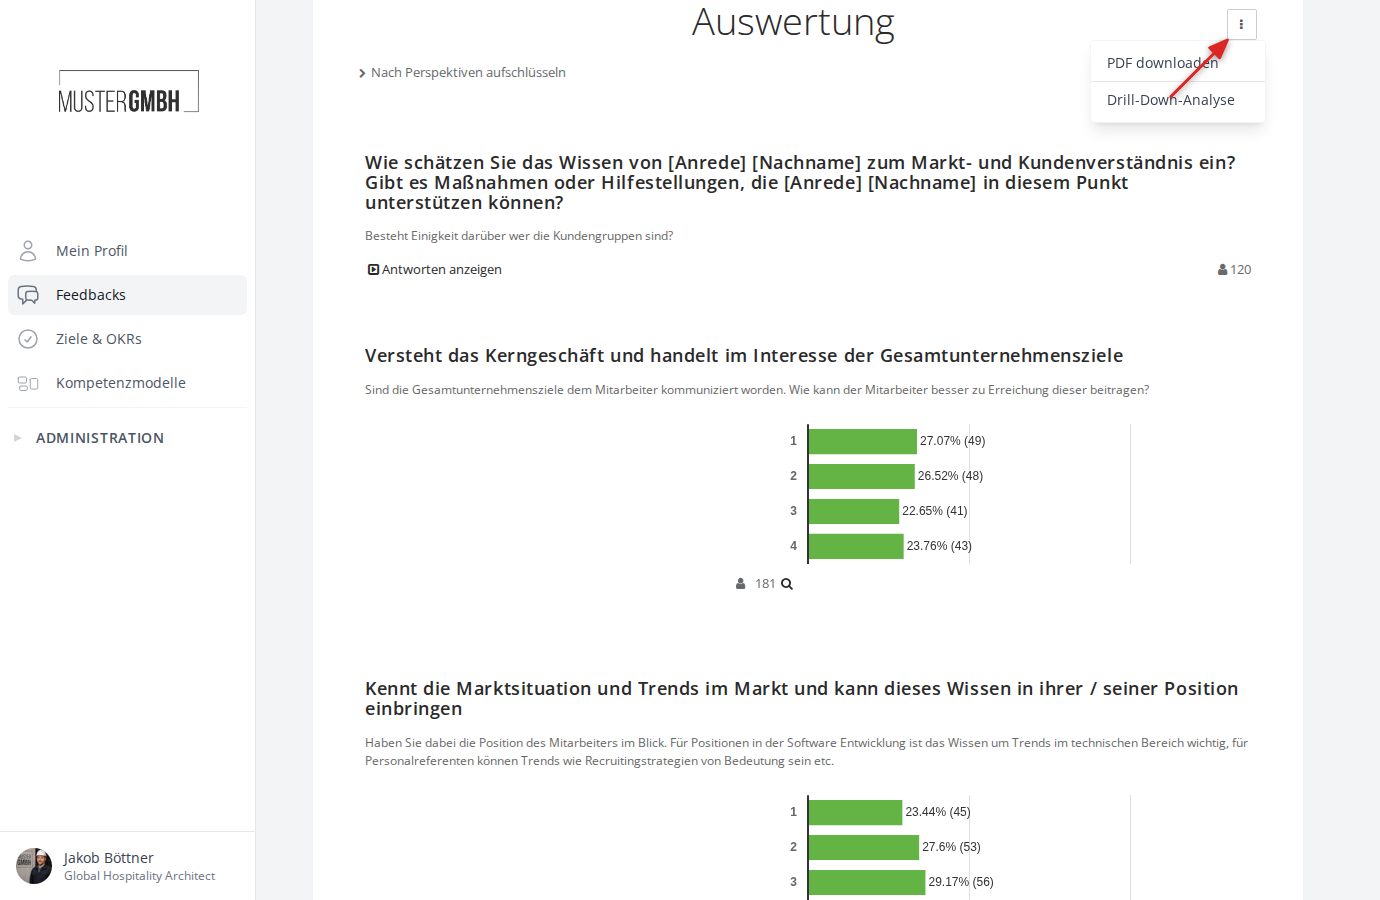
The results are then shown grouped by the values of the chosen field.
Filter results
Using the All results dropdown to the right of the tabs, you can filter the evaluation.
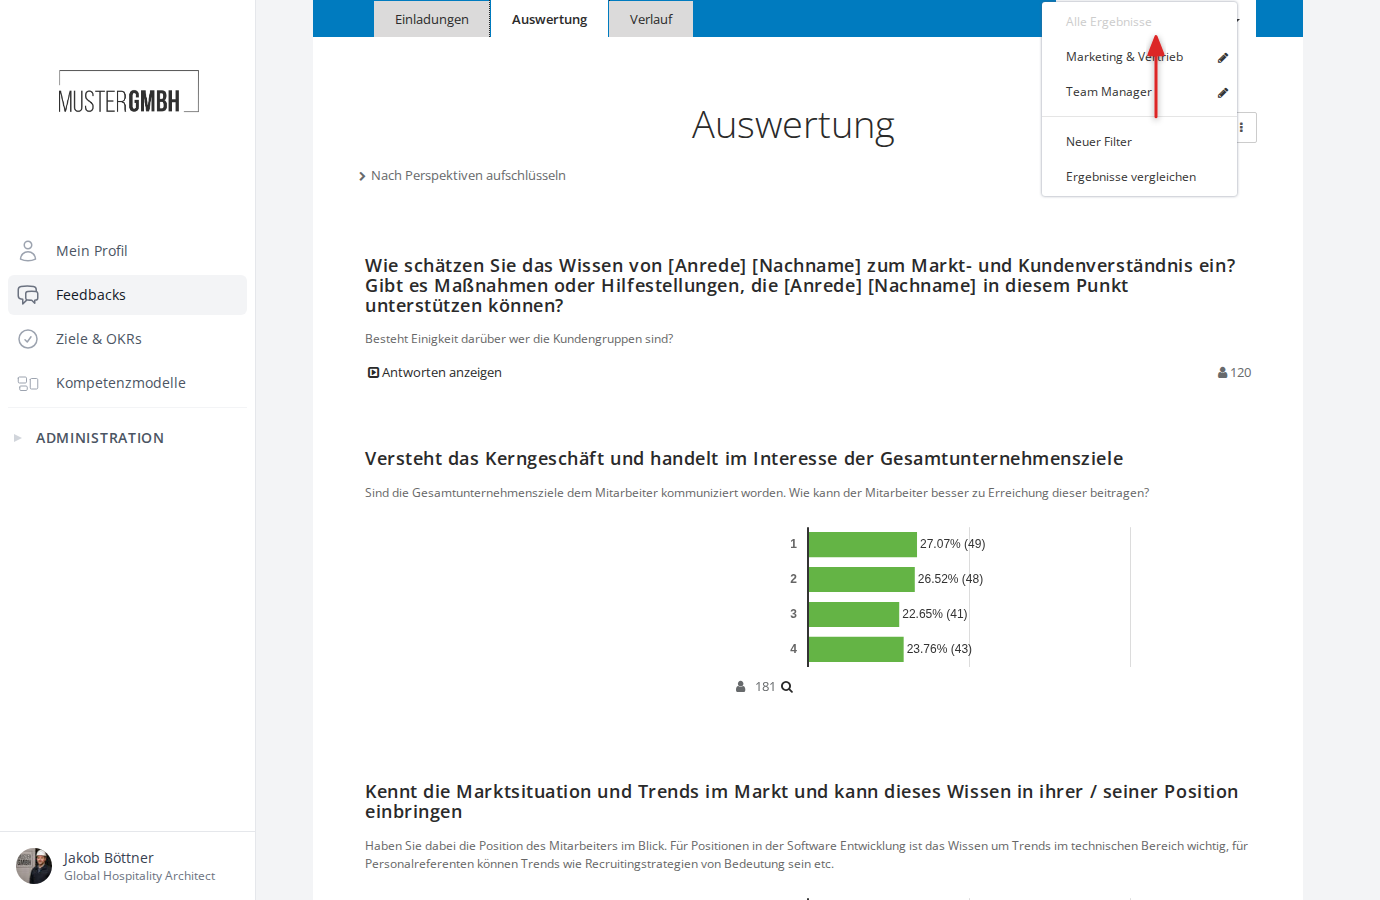
- All results: Shows the evaluation across all completed participations (default view).
- New filter: Creates a new filter. You can filter by criteria such as perspective, supervisor, or custom fields.
- Compare results: Opens the comparison mode. You can compare several filters or editions side by side. The results are then shown color-coded in the charts.
Saved filters appear as their own entries in the dropdown and can be edited using the pencil icon.
PDF export
Click the three-dot menu (⋮) to the right of the “Evaluation” heading and then Download PDF to download the entire evaluation as a PDF file.