Filter, compare, and drill down in dashboards
A filter limits whose results you see. A comparison places several data selections side by side. A drill-down shows groups within one analysis. Both comparisons and drill-downs help answer “How do our departments differ?”, but provide different views.
Look at a subset of the results
Open the filter menu to the right of the tabs. Initially, it is labeled All results. Select a saved filter or use New filter to create one, for example for the “Service” department or a user group.
The filter applies to the dashboard’s data selection. The questions and perspectives configured in a card narrow that selection further. A card cannot bring back data excluded by the active filter.
The instructions for creating and activating a filter also apply to dashboards. Choose All results to remove the selected filter. Your access rights still apply.
Compare two departments or editions
Choose Compare results in the filter menu. Select the combinations of filter and edition you need, such as “Development” and “Service” in the same edition. Choose different editions for a comparison over time.
In a response distribution, the selections appear in one chart, with a bar for each selection at each response value. The legend identifies the colors. In the example, “Service” selected higher response values more often.
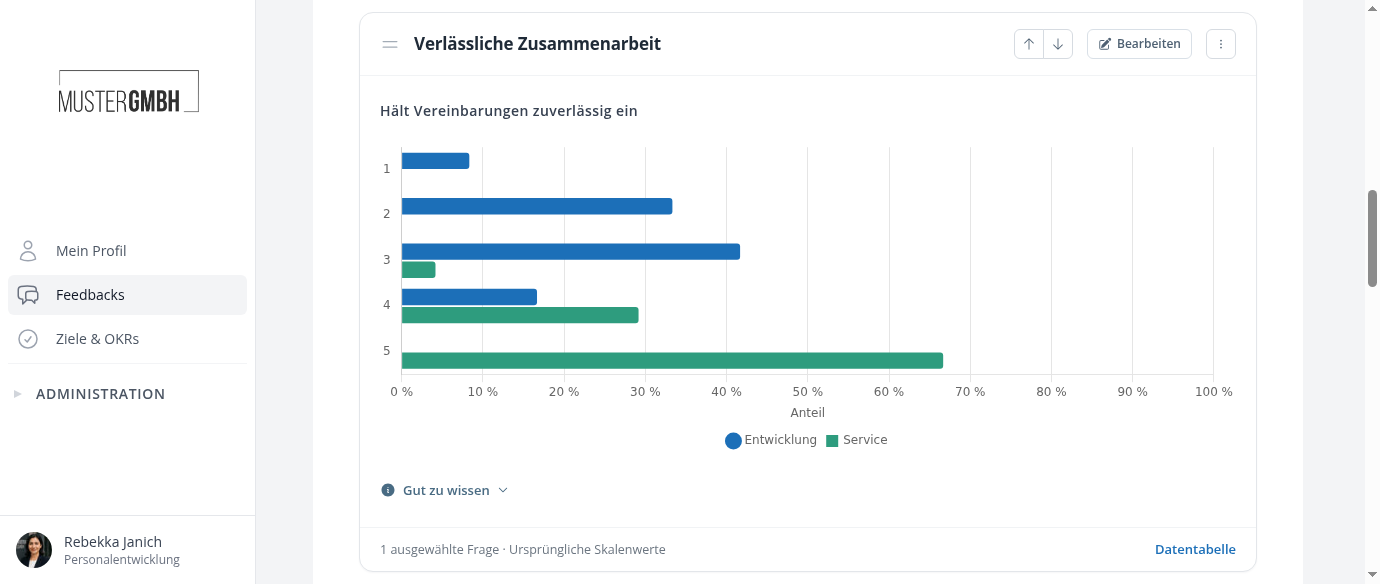
Other elements arrange comparisons to suit their data, such as additional table rows or separate text lists. Check the selection names and editions. To end the comparison, return to a single selection in the filter menu.
See all departments in one table
Add a drill-down under One question. Select the question, then choose an attribute such as “Department” or “Location” under Break down by. The available list and yes/no fields, as well as user groups, can be used.
| Element | What the table shows |
|---|---|
| Drill-down: Responses | Groups in rows and response options in columns, with counts and percentages. Where strength scores are configured, it also shows average strength. |
| Drill-down: Strength scores | The distribution of configured strength scores within each group. |
| Drill-down: Text questions | The number of people and text responses per group. Click a group name to open its responses. |
With multiple perspectives, you can expand the groups. Expand all perspectives opens the perspective rows for every group.
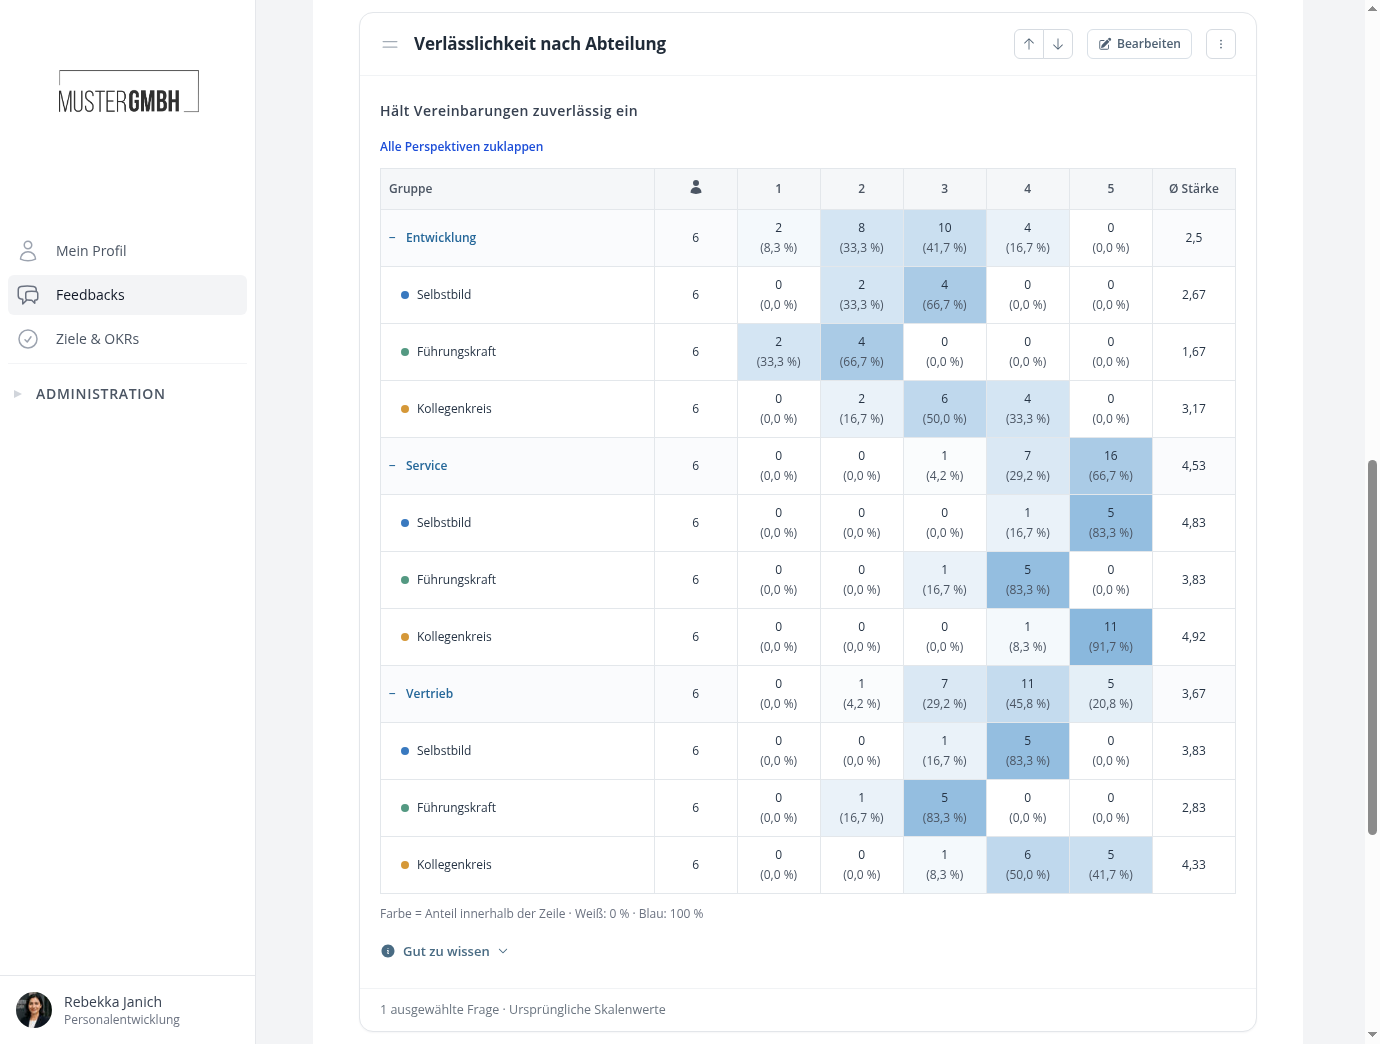
In the response table, color represents the percentage within the row. A share of 50 percent has the same intensity everywhere, making large and small groups easier to compare. Not specified collects people with no value for the chosen attribute.
Grouping uses current employee attributes and group memberships. A drill-down of an old edition therefore does not reconstruct historical departments.
Move from a department to individual people
For personal strength scores, use the people overview under Entire feedback round. You can also break it down by a list or yes/no field. The group row shows the average; expanding it reveals the people. A heatmap view is available too.
Why are values missing after a breakdown?
A large selection may contain enough responses overall, while a single department or perspective has too few. Values are then withheld to protect anonymity. Missing responses or limited data access may also reduce the selection.
A filter or drill-down does not expand your permissions. Check the card’s notices and what the result states mean.