View the potential analysis
The potential analysis gives you a quick overview of how your colleagues are distributed across the potential levels you defined.
The evaluation combines a bar chart of that distribution with a table of every participation’s strength values.
In new dashboards, use the people overview and competencies to analyze the whole feedback round. It does not replace potential levels.
Prerequisites
The “Potential analysis” tab only appears when strength values are configured for the feedback. It is not available for anonymous feedbacks or multi-rater feedbacks (360° feedback).
Open the potential analysis
- Open the status page of the feedback.
- Click the “Potential analysis” tab below the response rate.
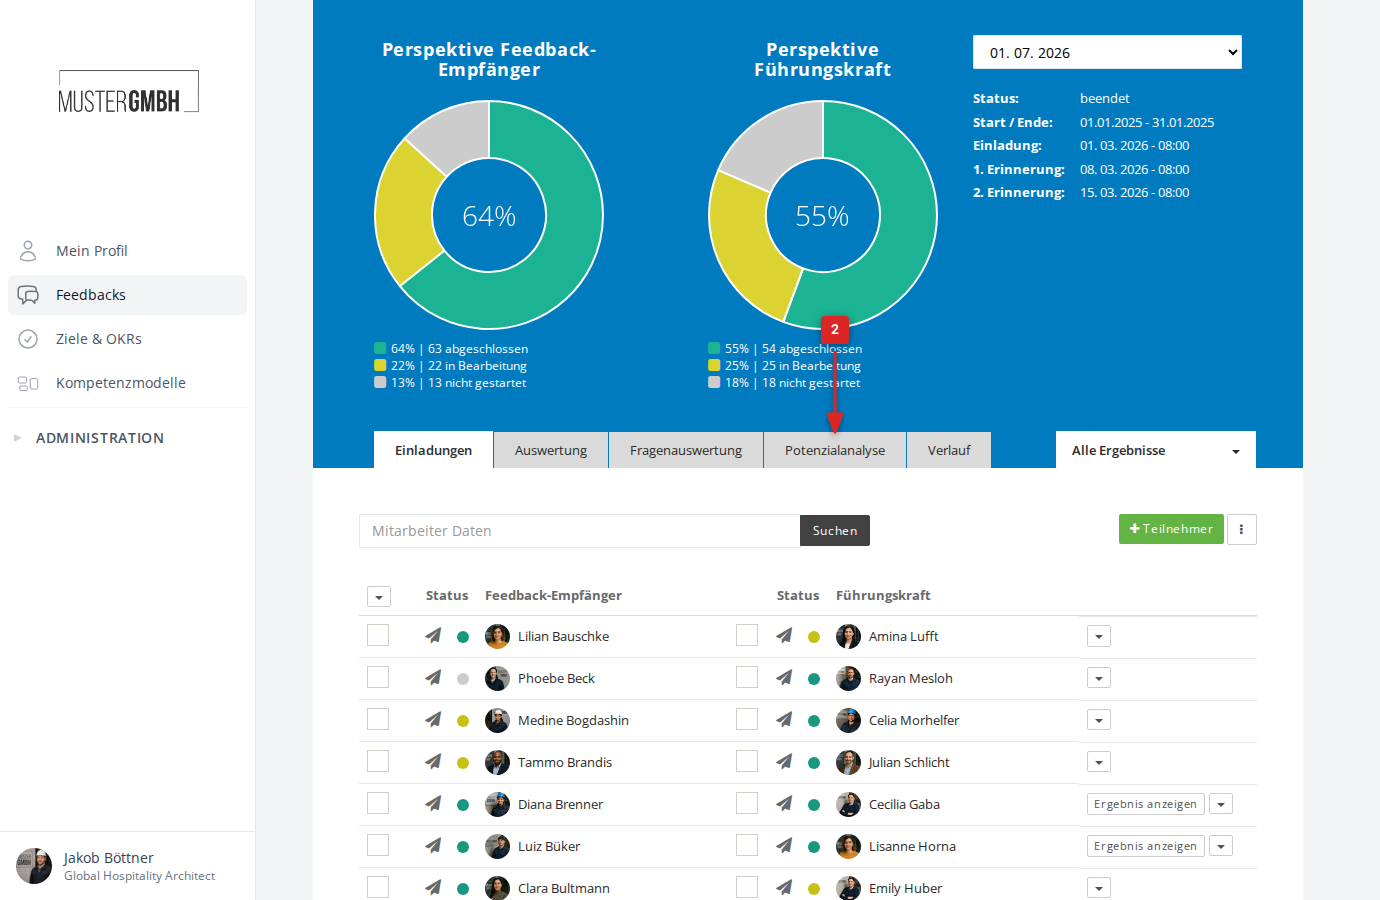
You now see the potential analysis for this review edition.
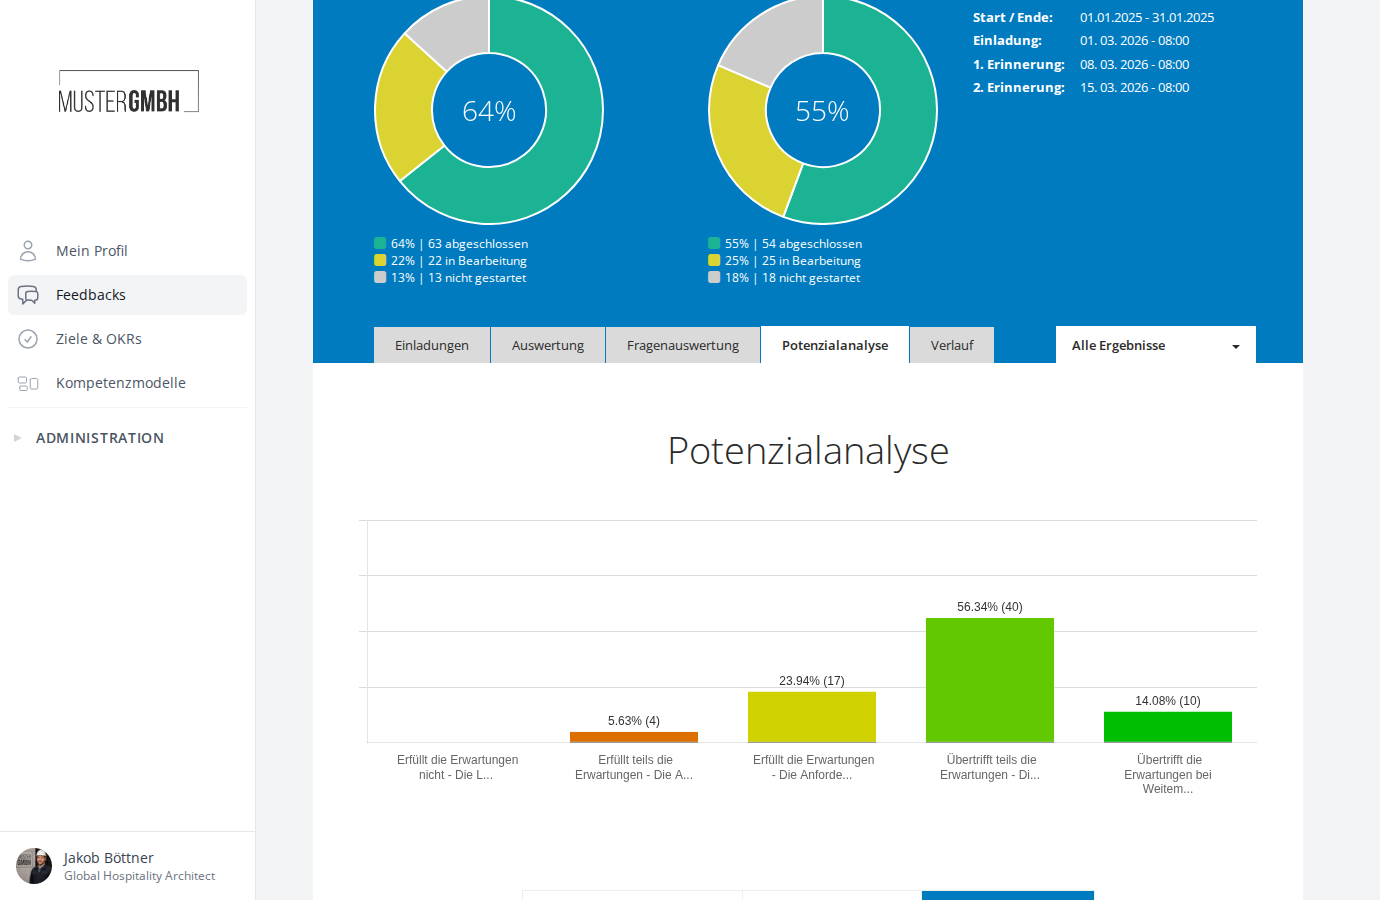
Distribution across the potential levels
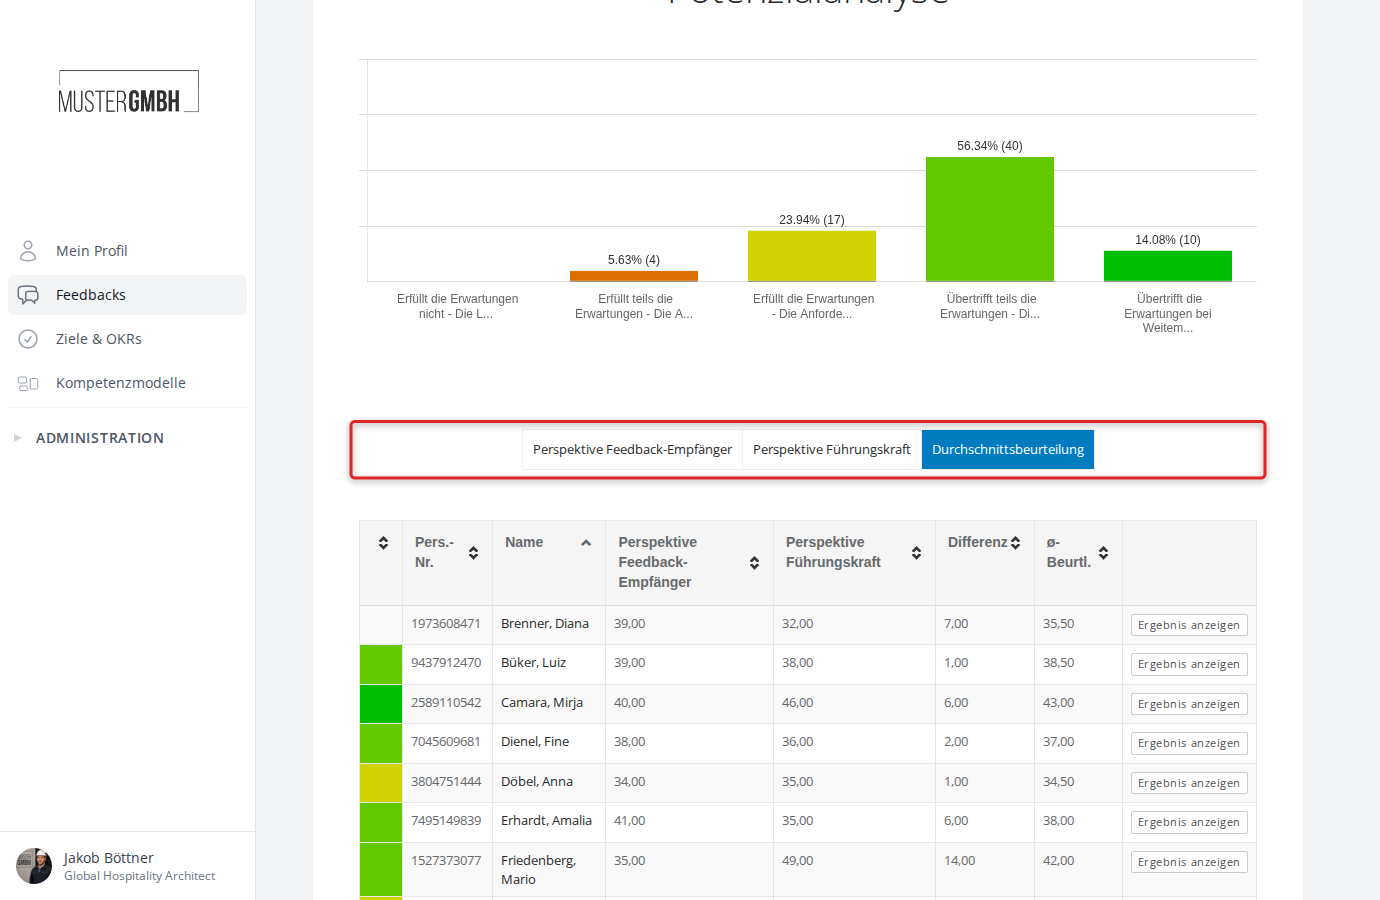
At the top of the evaluation, a bar chart shows how participants are distributed across the configured potential levels. Each bar stands for one level and uses that level’s color.
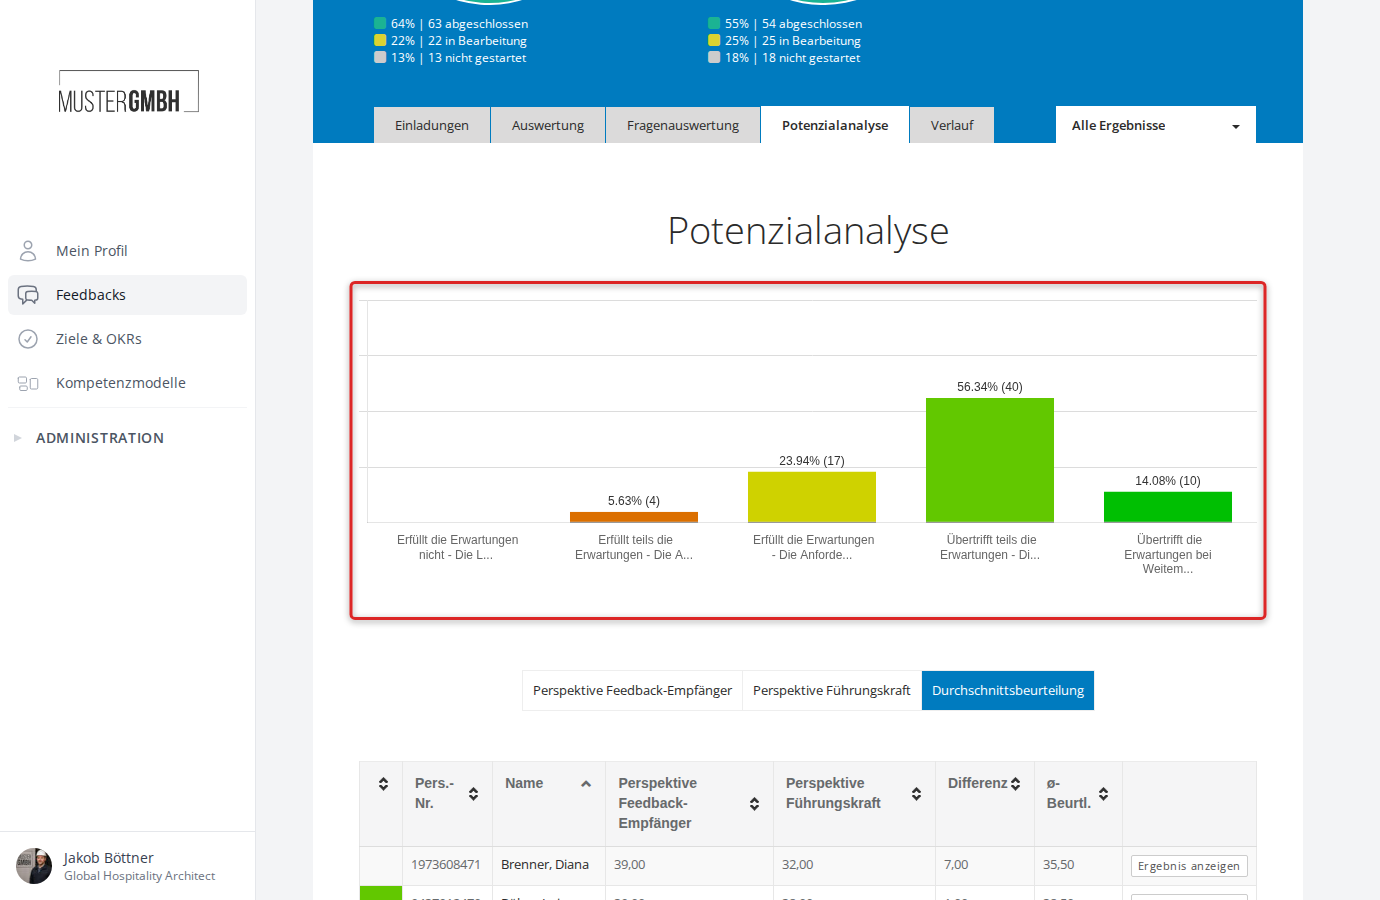
Switch the calculation basis
For feedbacks with more than one perspective (for example self-assessment and external assessment), you can switch which perspective the chart is based on. Below the chart you’ll find a button for each perspective plus one for the average. The button labels match the perspective names configured for the feedback (for example “Feedback recipient perspective”, “Supervisor perspective”) along with “Average assessment”.
Strength values of all participations
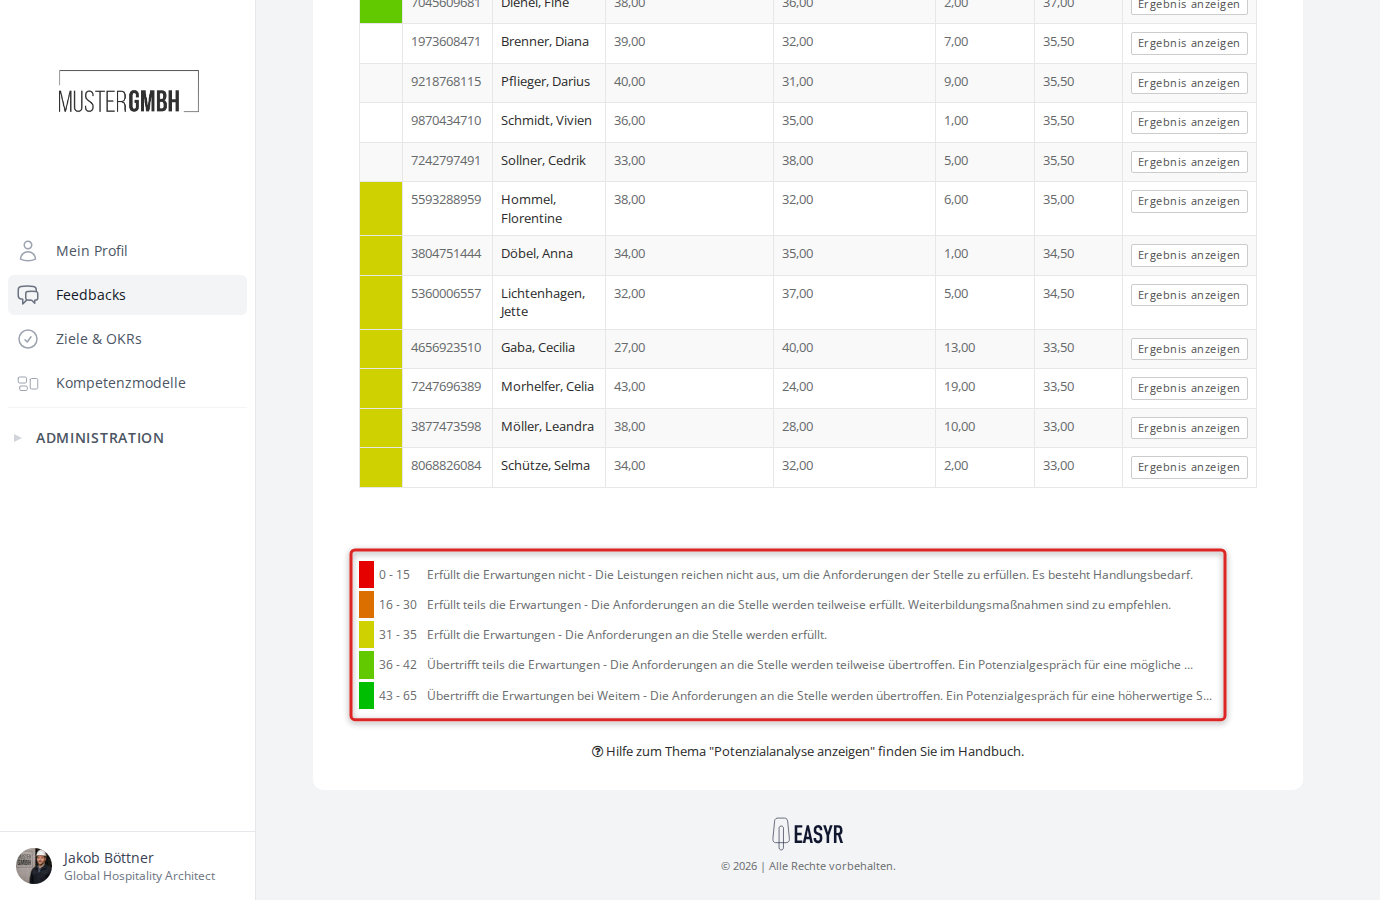
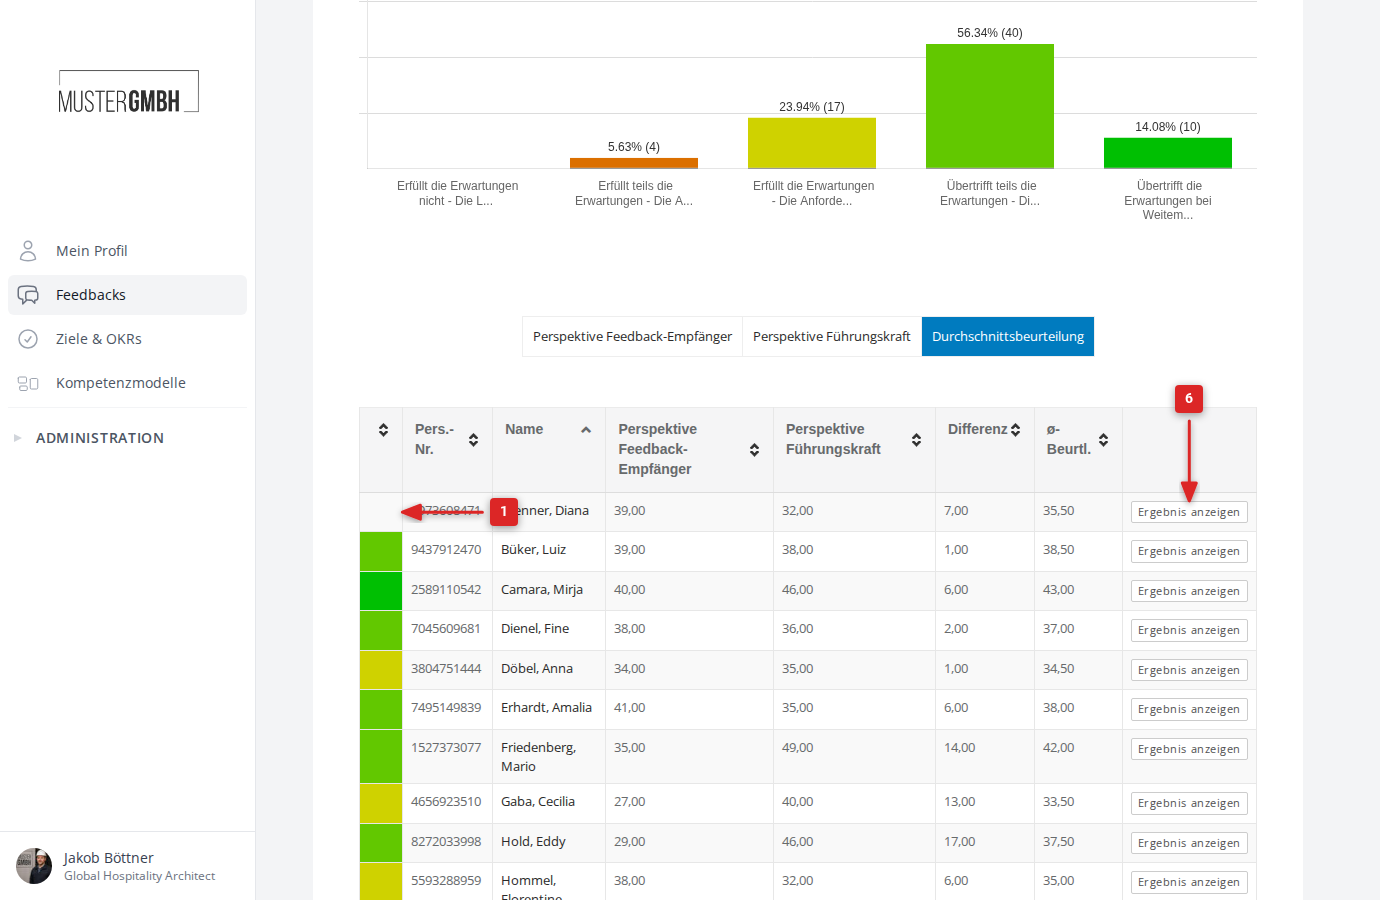
Below the bar chart is a table of every participation that has a viewable result. For each participation the table shows:
- The potential level reached, as a colored indicator.
- The staff number and name of the participant.
- The strength value reached per perspective (the column headers match the configured perspective names).
- The difference between the perspectives’ strength values (only for two-sided feedbacks).
- The average value (“ø assess.”).
- A “Show result” link to the result details.
Sort
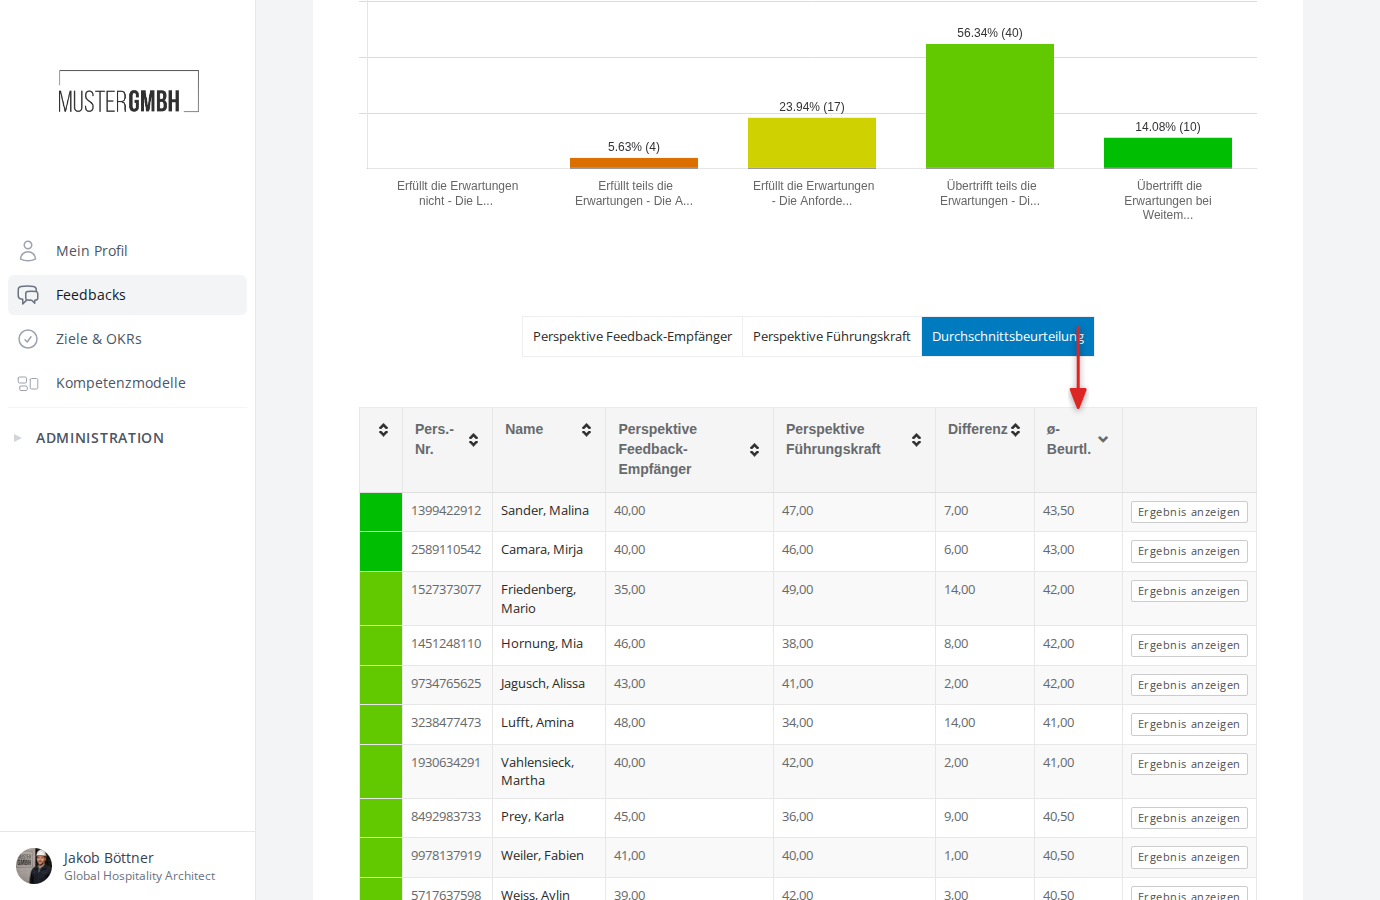
You can sort the table by any column. Click a column header to sort ascending or descending by that column; click again to reverse the order.
Potential-levels legend
Below the table you’ll find the legend for the configured potential levels. For each level it shows the point range and the description.