360° feedback: result view
The result view shows the collected answers of a 360 feedback for a specific person. All feedback givers are grouped by perspective (for example, Managers, Peers, Cross-Team), and the results can be shown in two display formats.
Open the result view
- In the sidebar, click Feedbacks.
- Click the name of the 360 feedback you want.
- On the status page you see the Review, Evaluation, and Time series tabs. The “Review” tab holds the participant list.
- In the row of the person you want, click Show result.
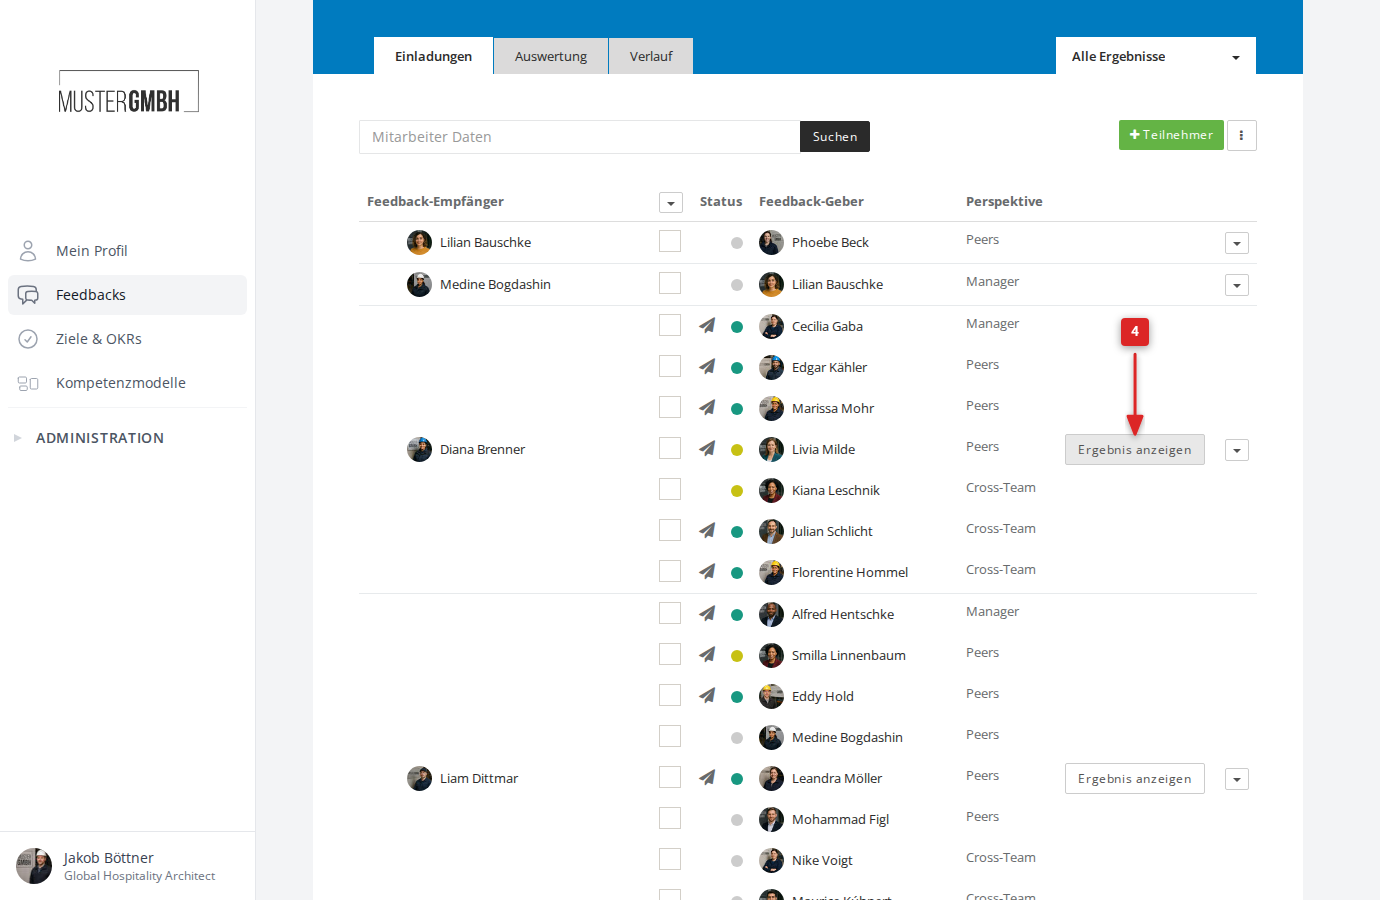
Layout of the result page
The result page is divided into several areas:
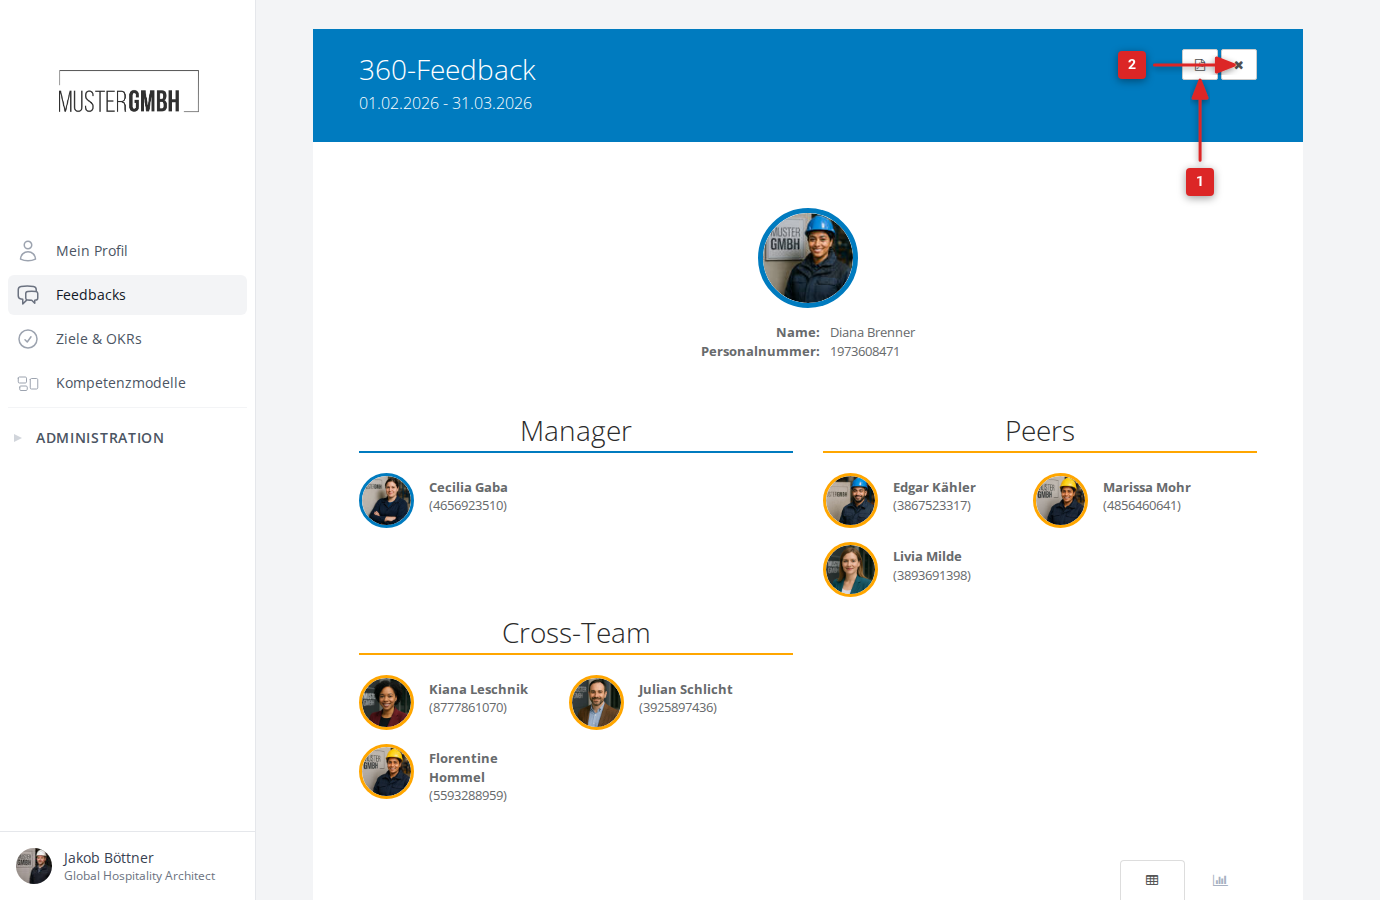
- In the blue header area are the name of the feedback and the period of the edition. In the top right are a PDF download button and a close button that takes you back to the overview page.
- Below that you see the details of the person being assessed (name, staff number).
- The feedback givers are grouped by perspective. Each perspective has a colored underline, and the people belonging to it are shown with an avatar, name, and staff number.
Display formats
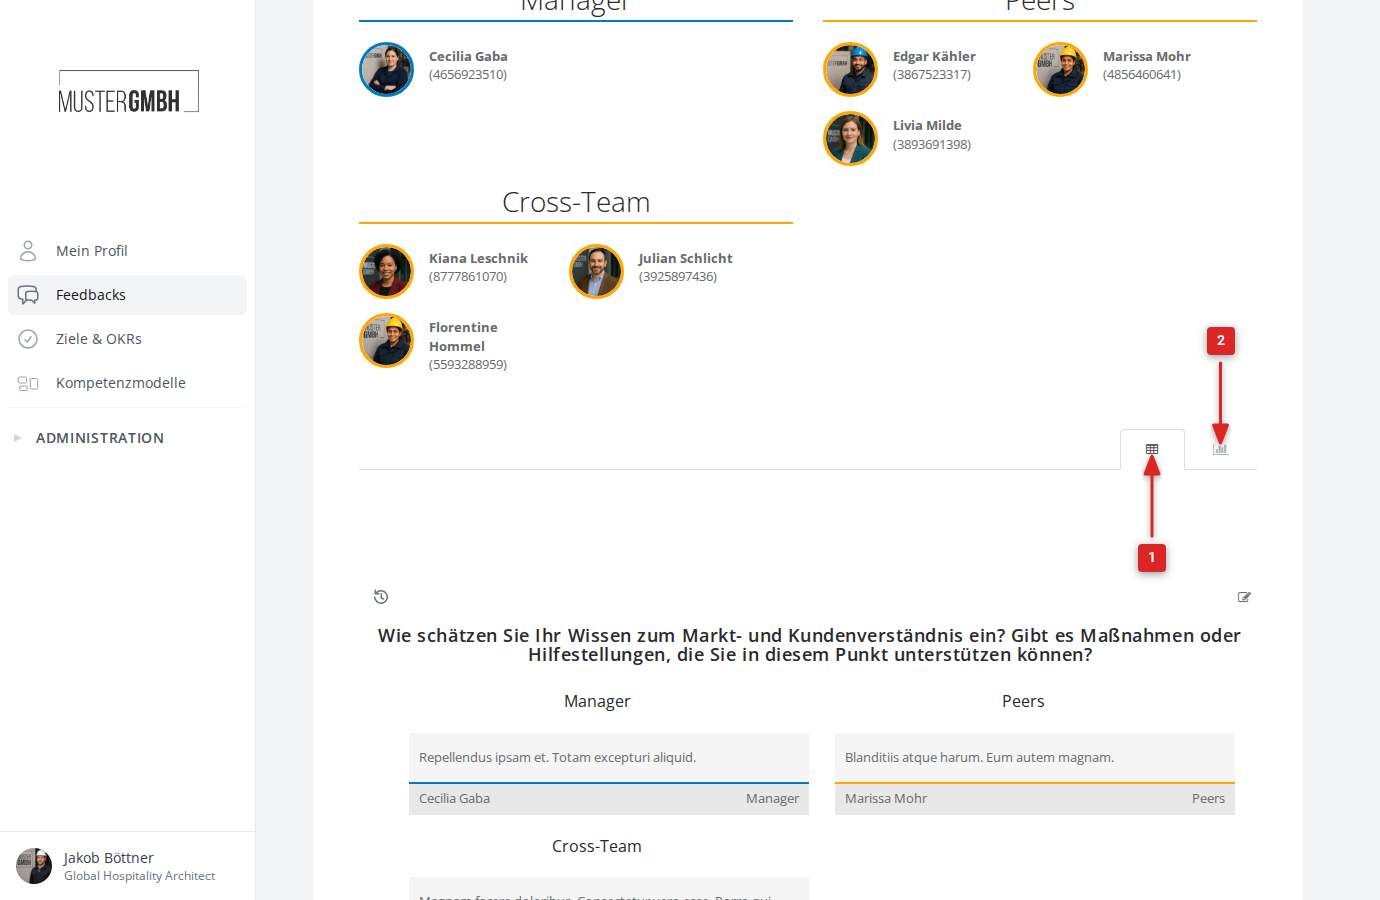
Below the participant overview you find two icons to switch the display:
- Table icon (heatmap): Shows the results as a colored table.
- Bar chart icon (stacked bar chart): Shows the results as stacked bars.
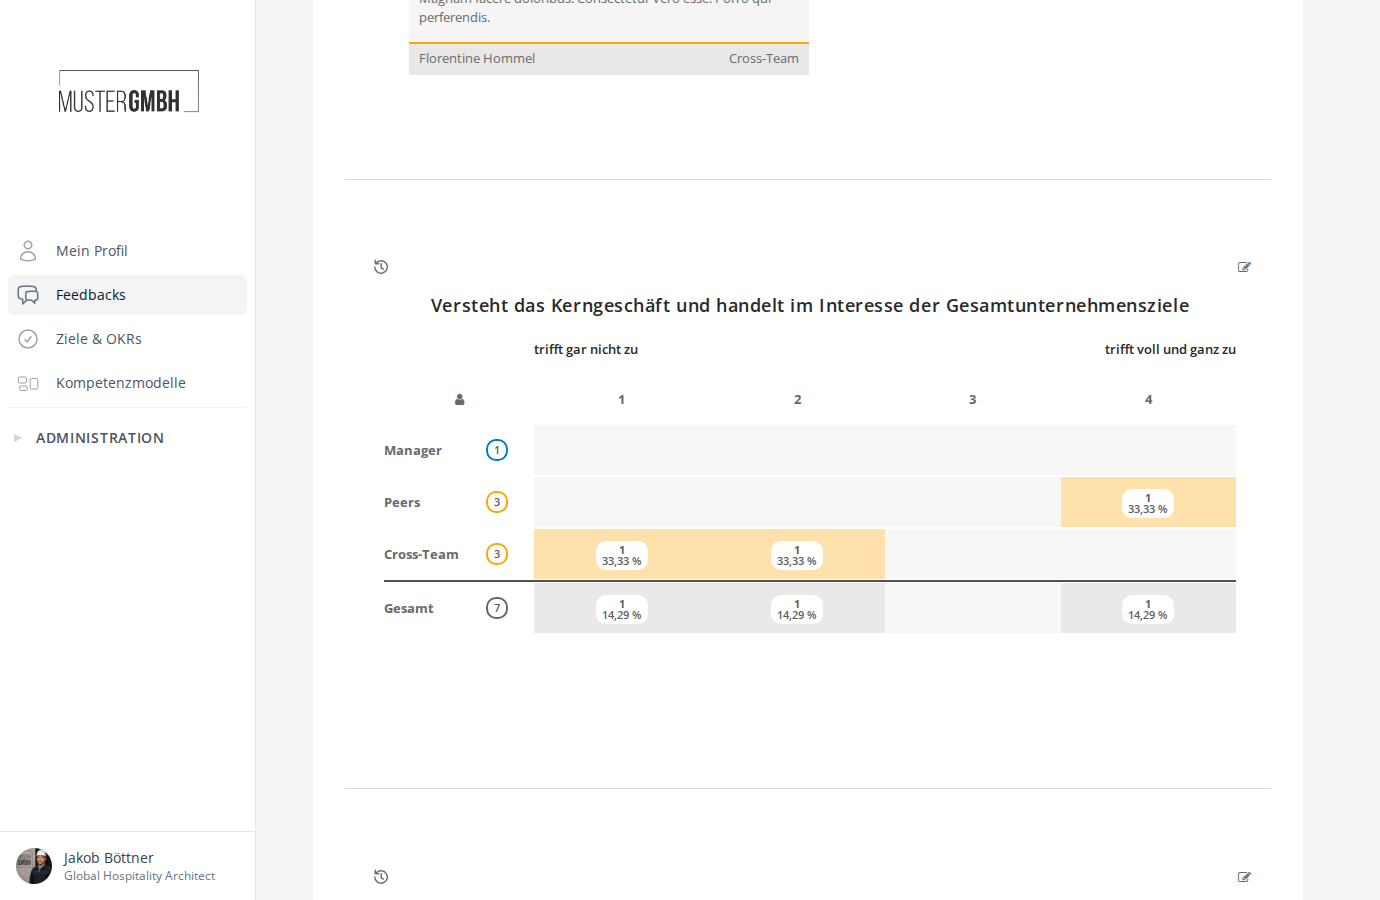
Heatmap view
In the heatmap view, one table is shown per rating question. The rows correspond to the perspectives (for example, Managers, Peers, Cross-Team), the columns to the answer options.
Each cell shows the count and percentage of answers. The color intensity indicates how many people from the respective perspective chose that answer. A Total row summarizes the results across all perspectives.
Bar chart view
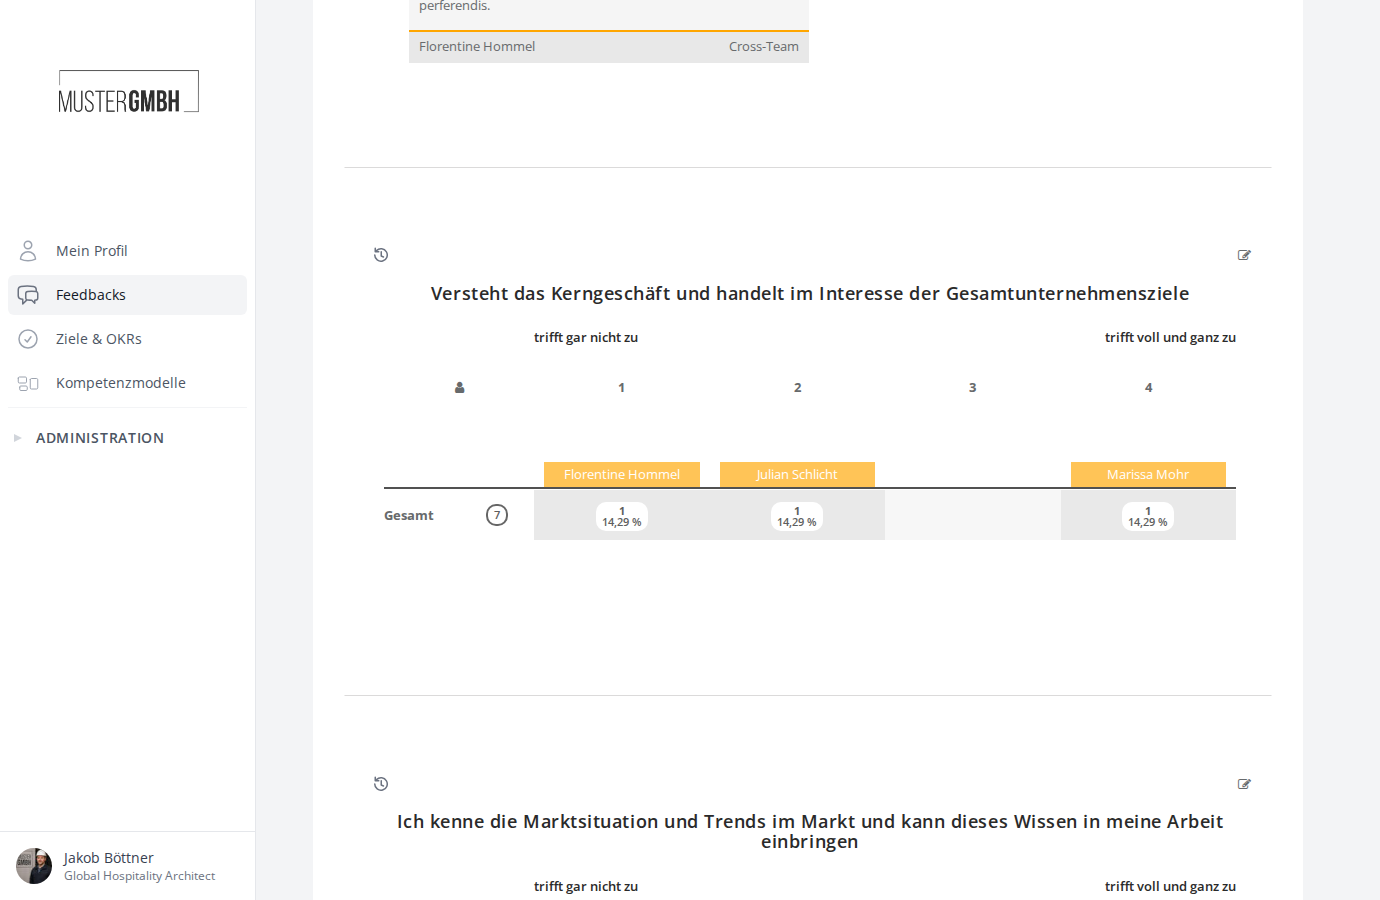
In the bar chart view, the answers are shown as colored bars. Each bar represents one person and is positioned at the chosen answer. The person’s name is shown directly in the bar.
The color follows the perspective of the feedback giver. The Total row shows the distribution as aggregated values with counts and percentages.
Text questions
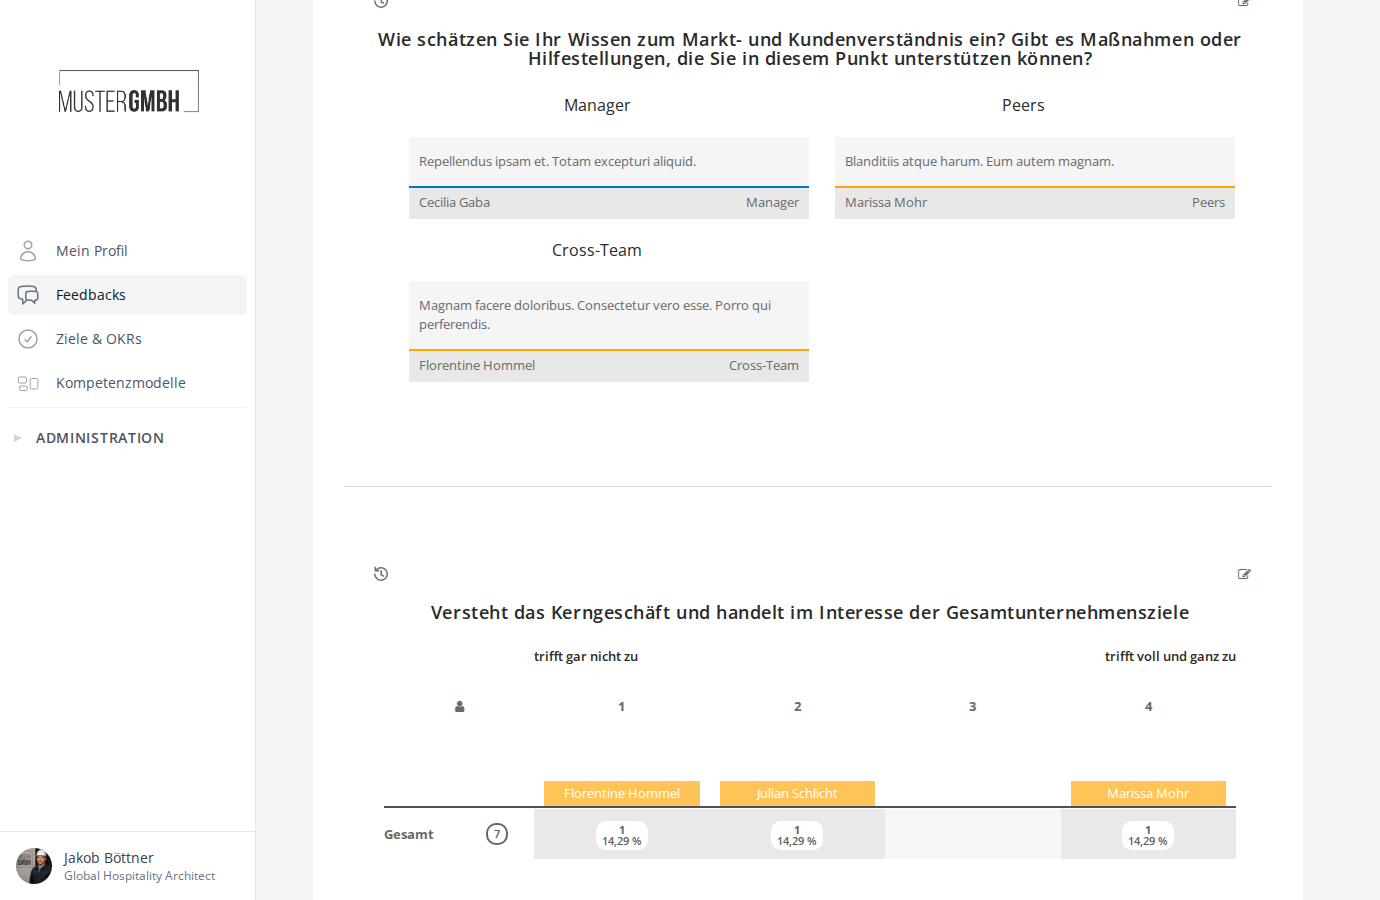
For free-text questions, the answers are shown grouped by perspective. Each answer shows the text, the name of the feedback giver, and the perspective.
Show and hide perspectives
You can show or hide individual perspectives in the result view. To do so, click the heading of a perspective (for example, “Managers” or “Peers”) in the header area. The results of that perspective are then hidden in the tables and charts. Clicking again shows them once more.
Edition comparison
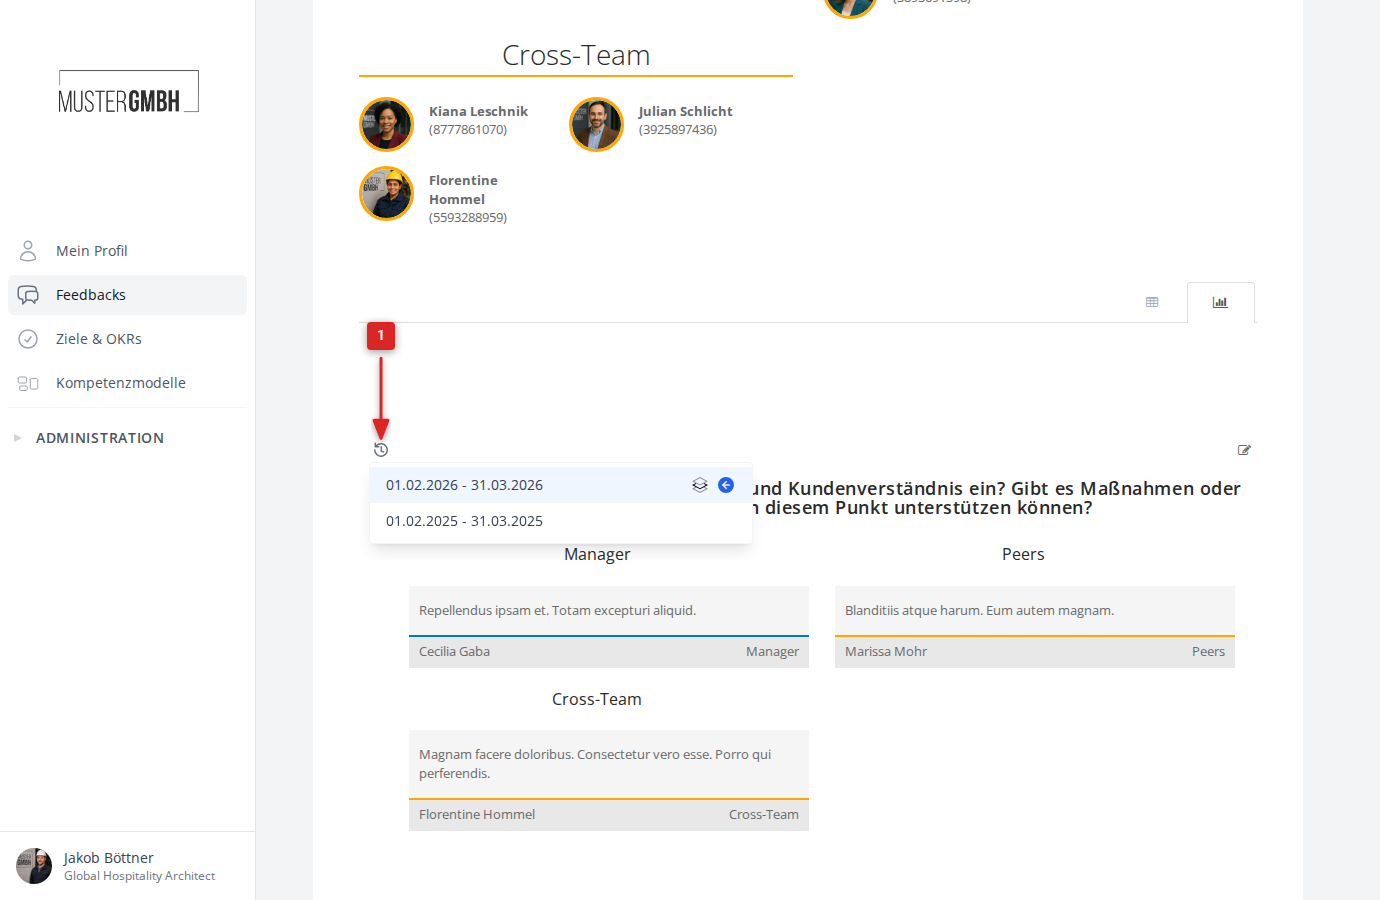
If several editions (cycles) exist for a 360 feedback, you can compare a question’s results with earlier editions. To the left of each question is a small comparison icon. Click it to open a dropdown with the available editions. Choose an edition, and the results of that question are replaced by the data of the chosen edition. This lets you track changes across several cycles.
Edit answers
To the right of each question is an edit icon. HR administrators can open a dropdown there and edit the answer of a specific feedback giver after the fact. This function is only available as long as the result has not yet been sealed.
PDF export
Click the PDF button in the top right of the blue header area to download the result page as a PDF. The PDF contains all questions and results in the currently chosen display format (heatmap or bar chart).