What is the potential analysis?
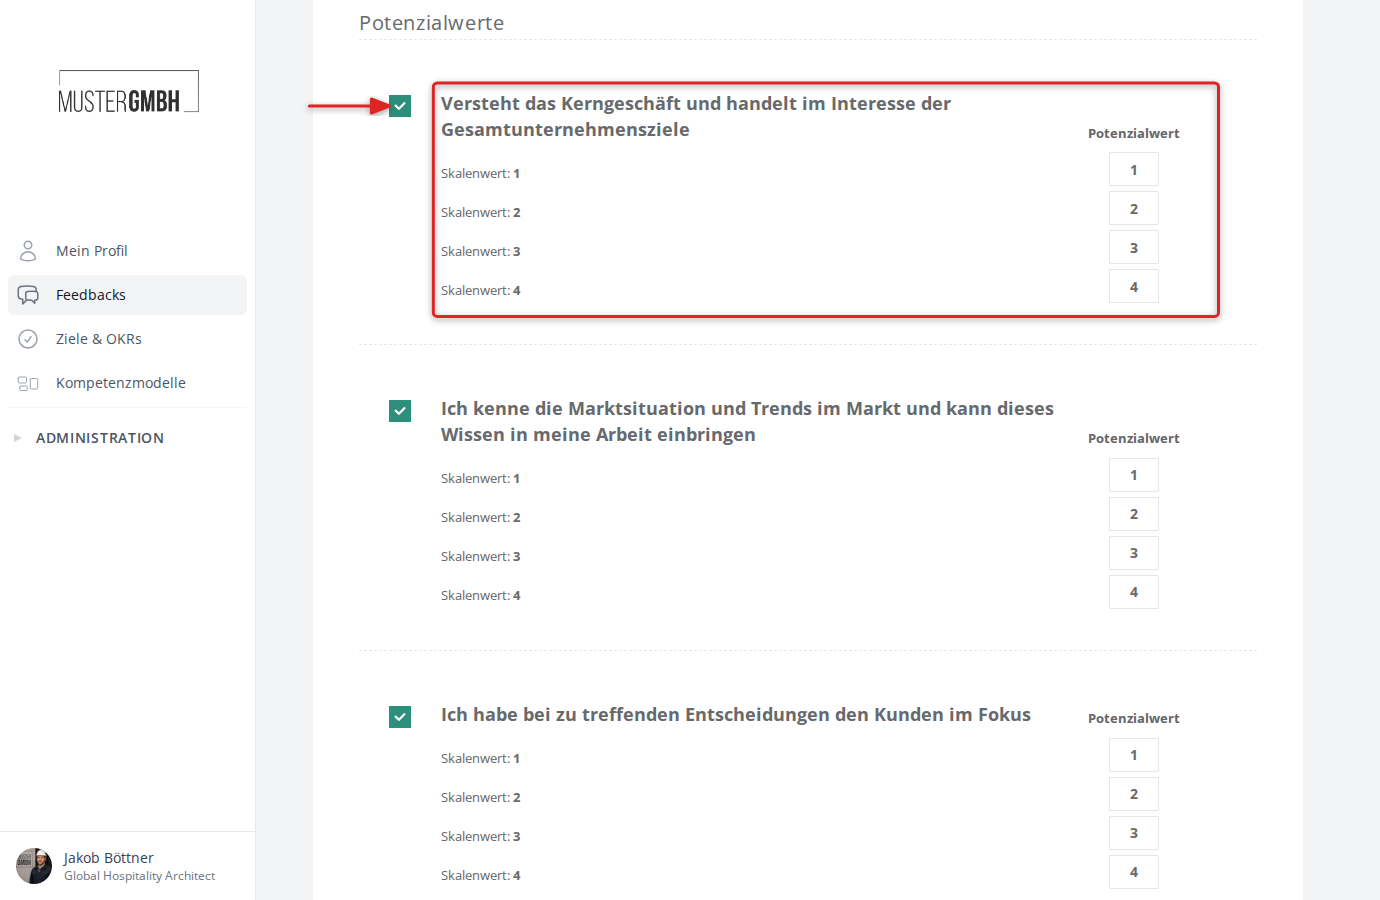
The potential analysis lets you quantify closed questions in a questionnaire. You assign each answer option a numeric strength value (potential value). This gives the answer options an order, from the strongest (highest number) to the weakest.
Participants never see the strength values while they take part. easyreview automatically computes the total strength per participation in the background and shows the results in the evaluation.
Example
The rating question
- “How open would you say you are to new ideas?”
has 4 answer options. With the potential analysis you assign each option a strength value:
- very closed: 1 point
- closed: 3 points
- open: 6 points
- very open: 10 points
Participants now collect points in the questionnaire depending on the answer they choose. You can turn the potential analysis on or off for each question individually. That way you can quantify only the performance-related questions, for example, while leaving satisfaction questions out.
Core concepts
Strength values (potential values)
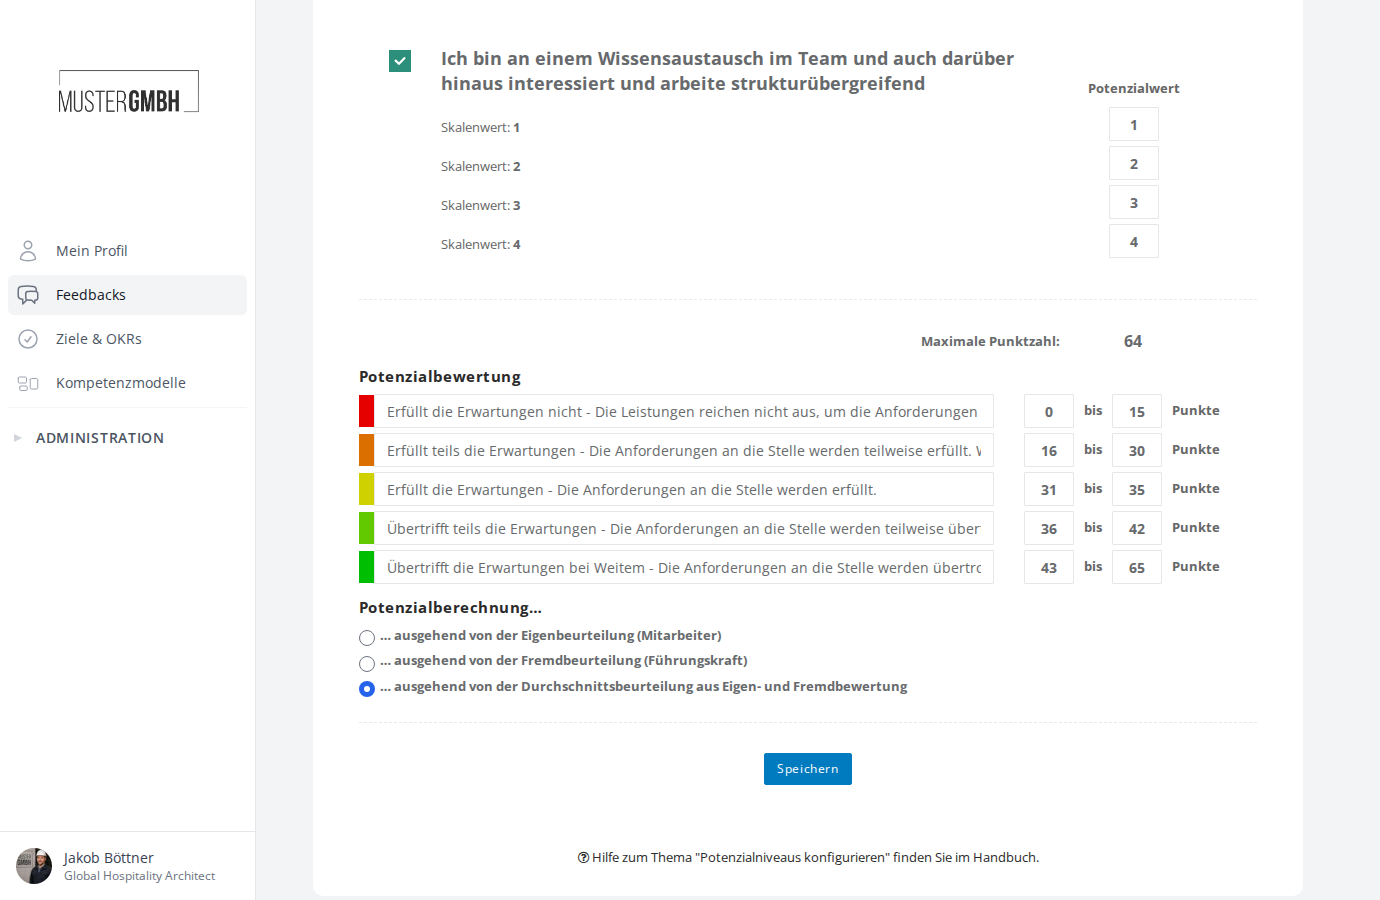
Each answer option of a closed question gets a numeric value. For every participation, easyreview automatically adds up the total score from all answers. The configuration page shows the Maximum points in the top right — the highest total that can be reached.
Potential levels
You can define five color-coded levels (from red to green). For each level you set a label and a point range, for example “Meets expectations” for 31 to 35 points. In the evaluation, each participant is assigned to the matching level and marked with its color.
Potential calculation
For reviews with two perspectives (self-review and external review), you choose the basis for the calculation:
- Self-assessment (employee): only the points from the self-review
- External assessment (supervisor): only the points from the supervisor’s review
- Average: the average of both perspectives
This setting determines which value is used to assign a participant to a potential level.
Competencies
Questions can be grouped into themed groups (“competencies”). In the evaluation, the results are then shown per competency, for example as a radar chart. This makes it easy to see exactly where the strengths and development areas lie.
Competencies are organized into categories. Each category contains one or more competencies, and each competency can be linked to any number of questions.
What the potential analysis reveals
For every participation, easyreview automatically computes the strength points reached across the perspectives (self-review, external review) and forms an average.
In the company-wide evaluation you see:
- A bar chart showing how participants are distributed across the potential levels
- A table with the strength values, the difference between the perspectives, and the average per participant
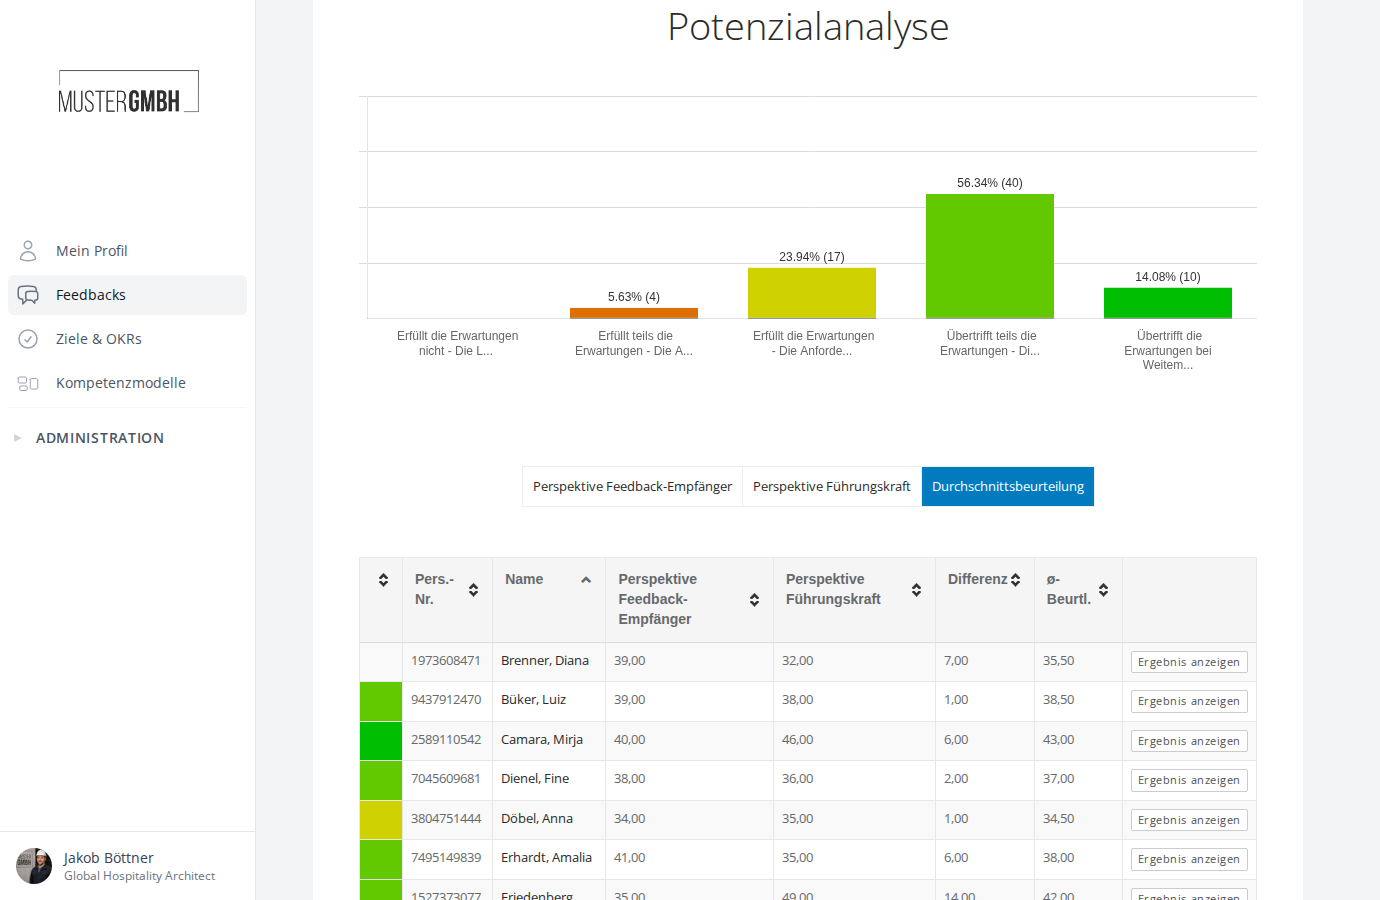
In the individual result view you see the strength values and differences per question. This makes it easy to spot where the supervisor’s and the employee’s assessments diverge.
To analyze a whole feedback round with strength values and competencies, see Analyze the whole feedback round.
Potential analysis and the competency model
Set up the potential analysis
This overview links to all the articles about setting up the potential analysis for a review.