Analyze the whole feedback round
Under Entire feedback round, you can answer two common questions: “How far along are we?” and “Where are our people’s or departments’ strengths?”. These elements do not require you to select individual questions.
How far along is the feedback round?
Choose Completion status and responses. The analysis distinguishes completed participations, those in progress, and those not yet started. Where there are multiple perspectives, you see their response rates separately. This helps you spot whether you are mainly waiting for managers, for example.
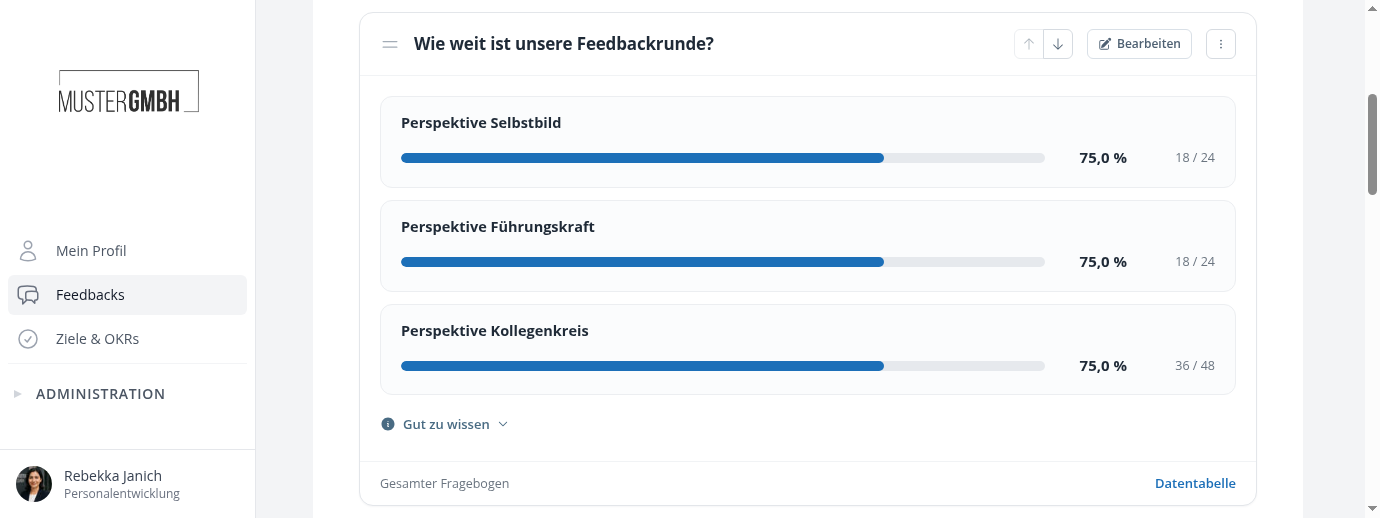
To compare editions, choose Participation over time and select the rounds. Your active data selection also applies here. An open link survey has no fixed invitation list to use as a denominator, so its figures should not be read like the response rate of a personally invited group.
Who is strong in which areas?
Choose People overview · Strengths and competencies. It shows the strength scores of feedback recipients whose results you can access. Alongside individual perspectives, it includes a combined result.
Search for people or click a column heading to sort. Open a person’s row to see details and, where permitted, their individual result. The Colour table helps you scan for patterns. Choose the table if you mainly want to read numbers.
This overview requires personal results with strength scores. It is unavailable for anonymous surveys. For anonymous department comparisons, use a question drill-down instead.
Which score basis should I choose?
Overall questionnaire strength score uses the strength scores of the questions configured for this purpose. Points are added per participation. Multiple ratings within one perspective are averaged per person, then the selected perspectives are combined with equal weight.
Configured competency analyses uses the competency categories from the potential analysis configuration. Select the categories you want to examine. Each category is analyzed separately.
The analysis uses the existing question assignments, sum or average within each competency, and the competency and perspective weights. Under Combine competencies into an overall result, choose how the competencies within a category are combined:
| Setting | Meaning |
|---|---|
| Weighted average | The default. Weighted competency values are divided by the sum of the contributing weights. |
| Weighted sum | Weighted competency values are added. More contributing competencies can produce a higher overall result. |
For example, professional expertise might have a weight of one and collaboration a weight of two. Both settings respect this ratio. They differ in whether the result is then divided by the contributing weights.
Missing values are not treated as zero. A competency category that does not apply to a person is also left unrated. An overall result may therefore differ from another view using different aggregation or perspectives.
Where are a department’s strengths?
Under Break down by, select a suitable employee attribute, such as the “Department” list field. Available custom fields of type list or yes/no can be used. User groups can be included through the data selection filters.
The group row shows the average of the personal results. Each person with a value has equal weight. The range shows the lowest and highest overall result. Expand a department to see the individual people below it. This also works in the heatmap.
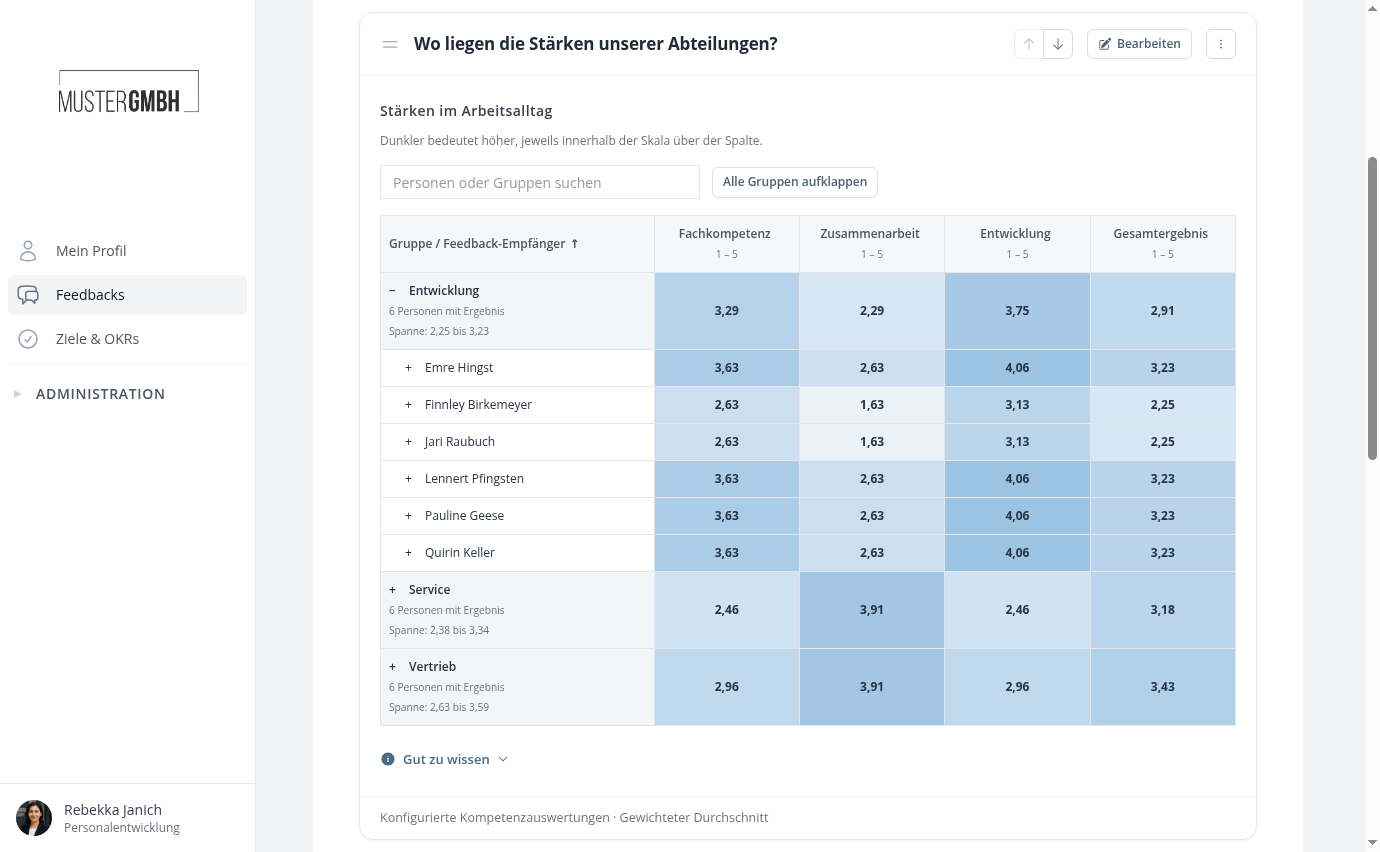
Check the scale above each column: darker means a higher value within that scale. Grouping uses the employee attributes currently on file, even when you are viewing an older edition.