View results
The evaluation of a review edition shows the aggregated results of all participations. It lets you spot company-wide trends or compare the results of individual departments.
How to reach the evaluation
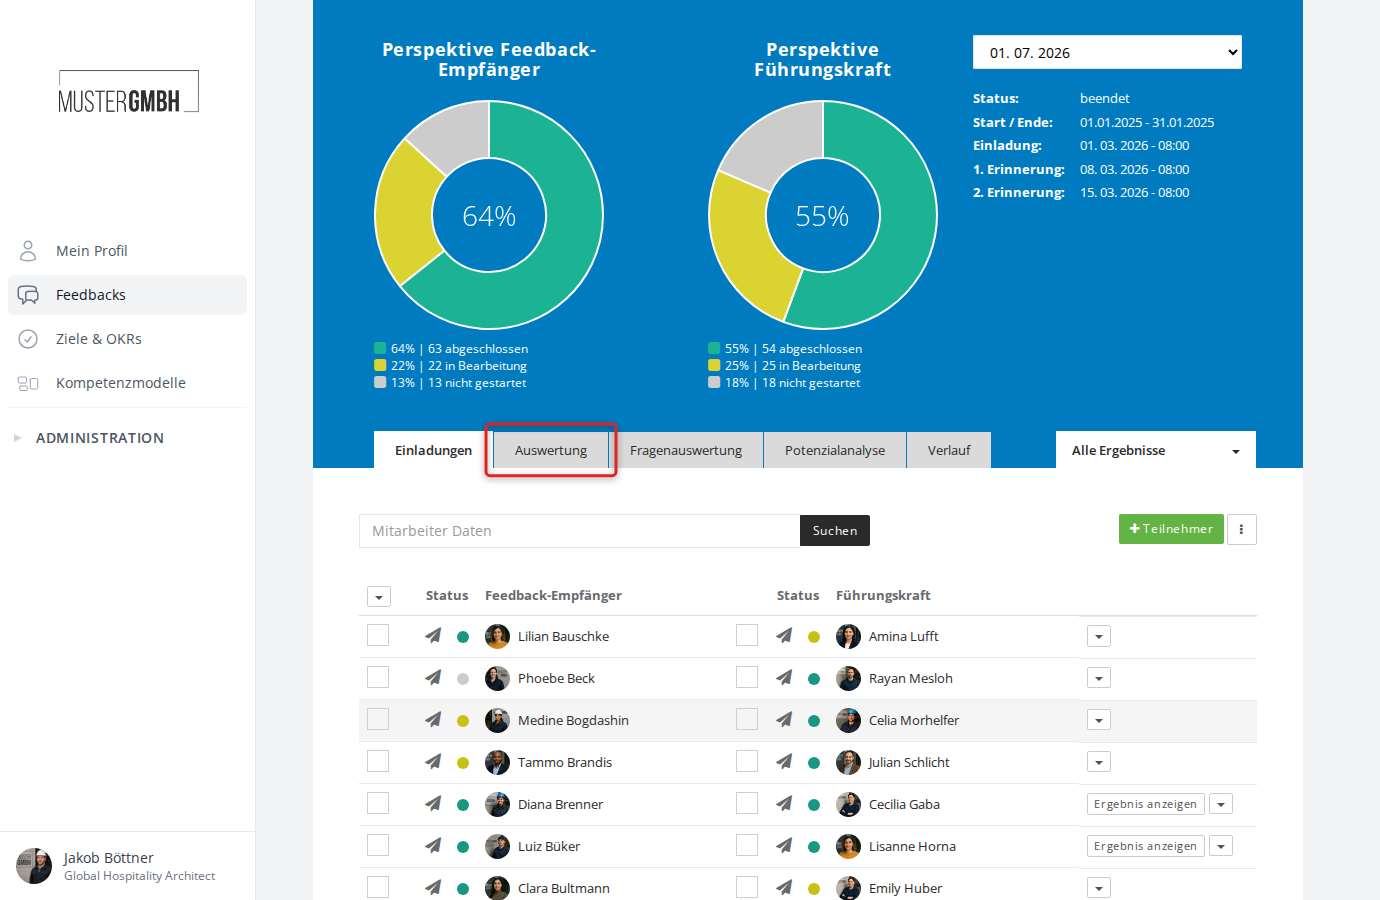
- Open the review status page
- Click the “Evaluation” tab
The results are shown per question, in the order they appear in the questionnaire.
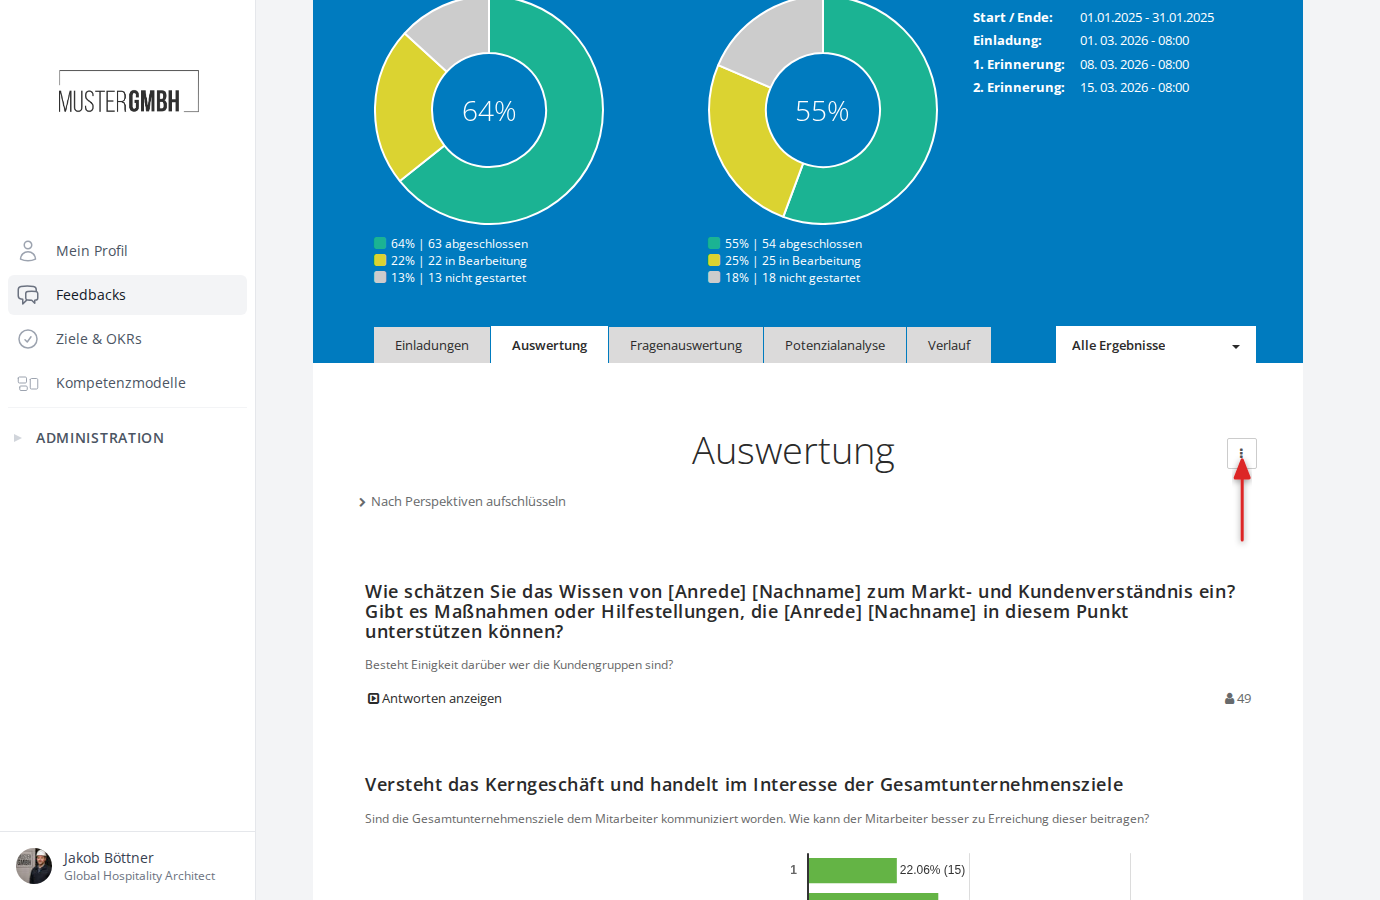
The three-dot menu at the top right gives you the following options:
- Download PDF: downloads the current evaluation as a PDF file
- Drill-down analysis: opens the breakdown by custom fields (see Drill-down analysis)
How the results are shown
Results are shown differently depending on the question type.
Open questions
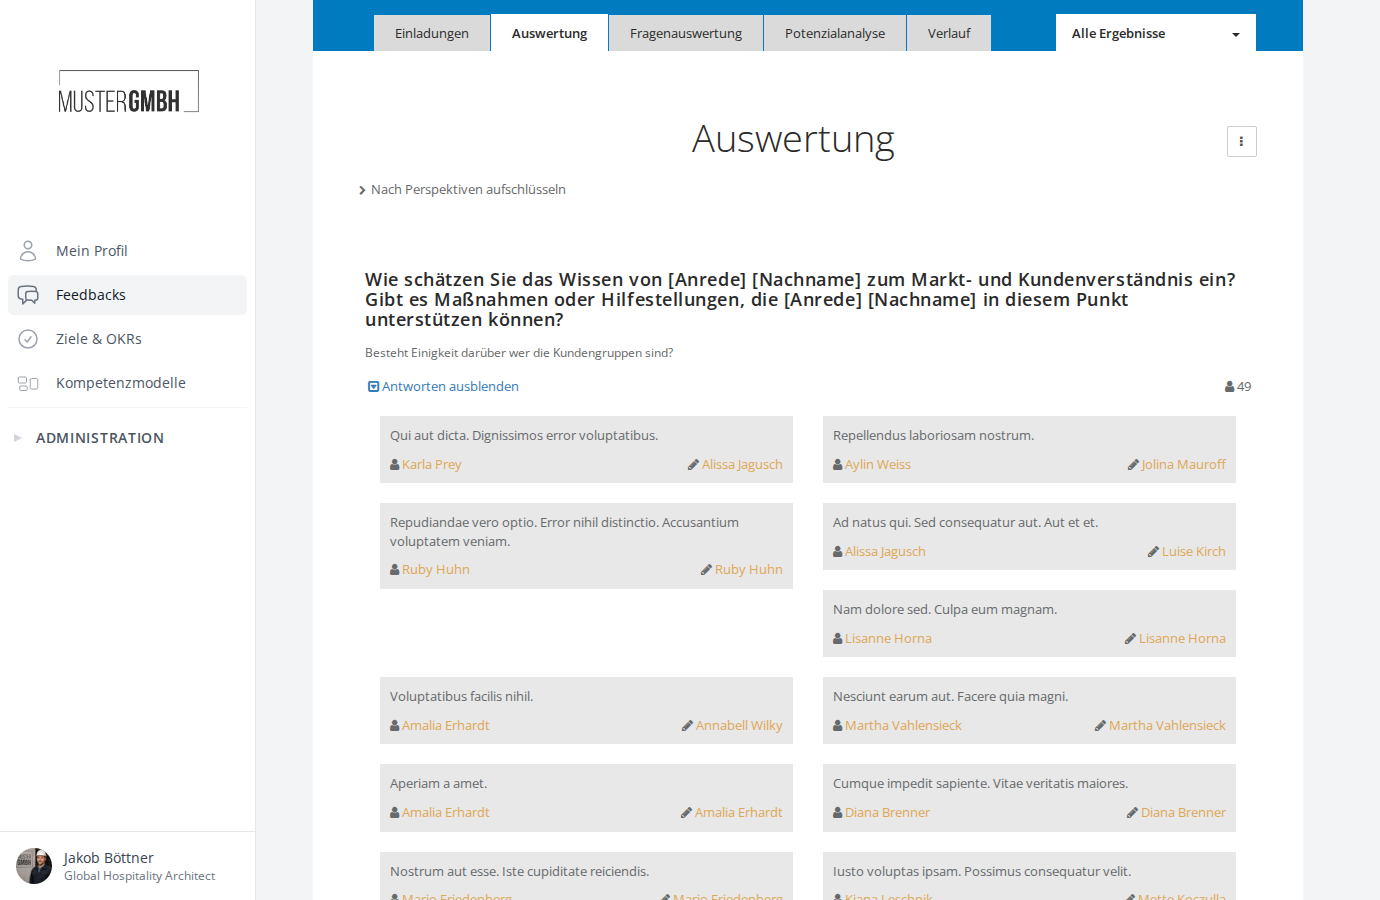
For open questions, the answers are collapsed at first. Click “Show answers” to see the individual text answers. The total number of answers is shown on the right.
Each answer shows the text and — for non-anonymous reviews — the feedback recipient and the author.
Closed questions
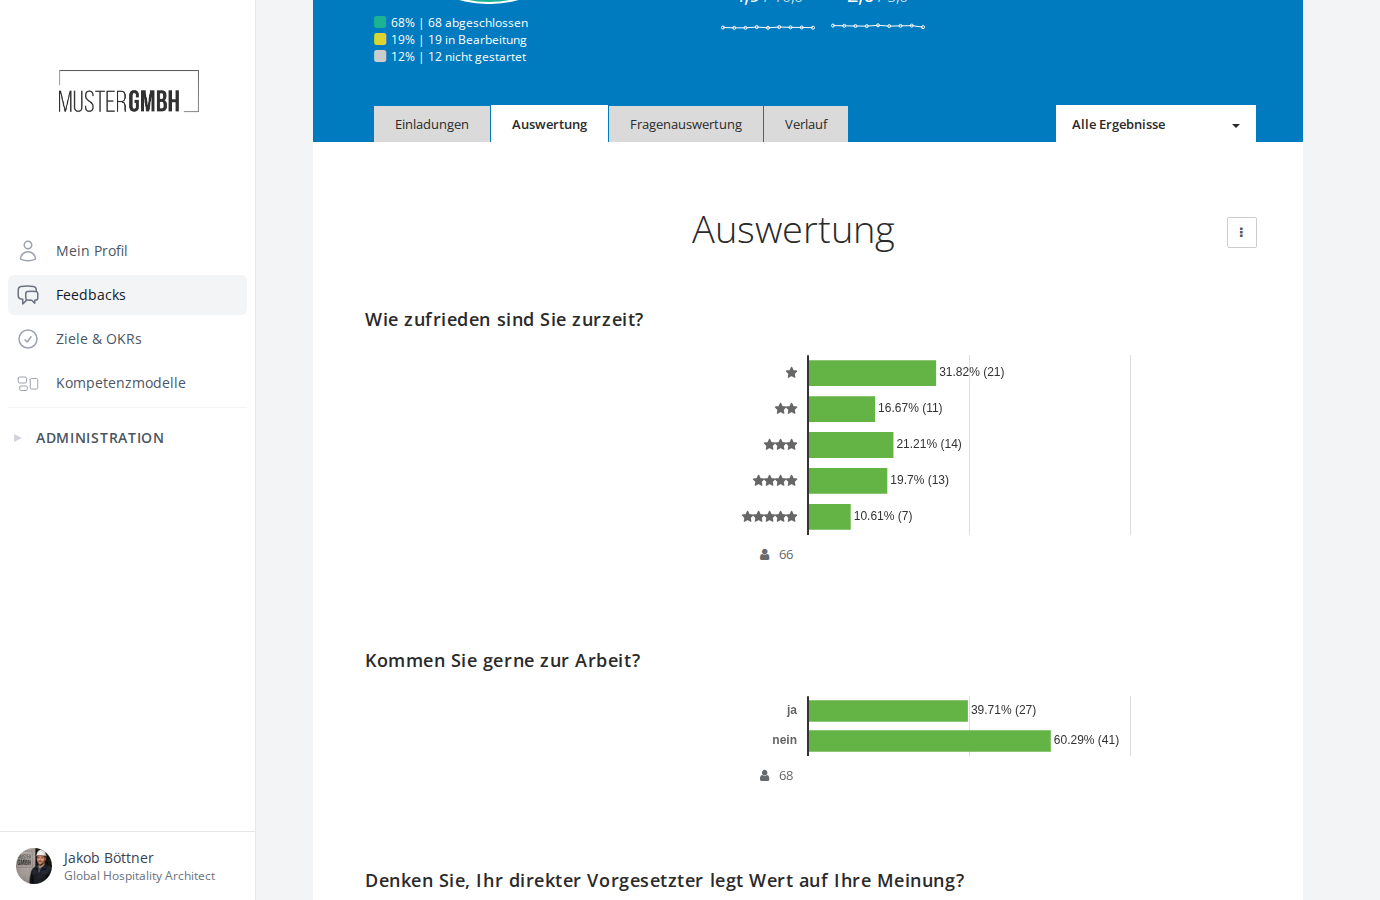
Closed questions are shown as a horizontal bar chart:
- Each bar shows one answer option with its percentage share and absolute count
- The total number of participants is shown below the chart
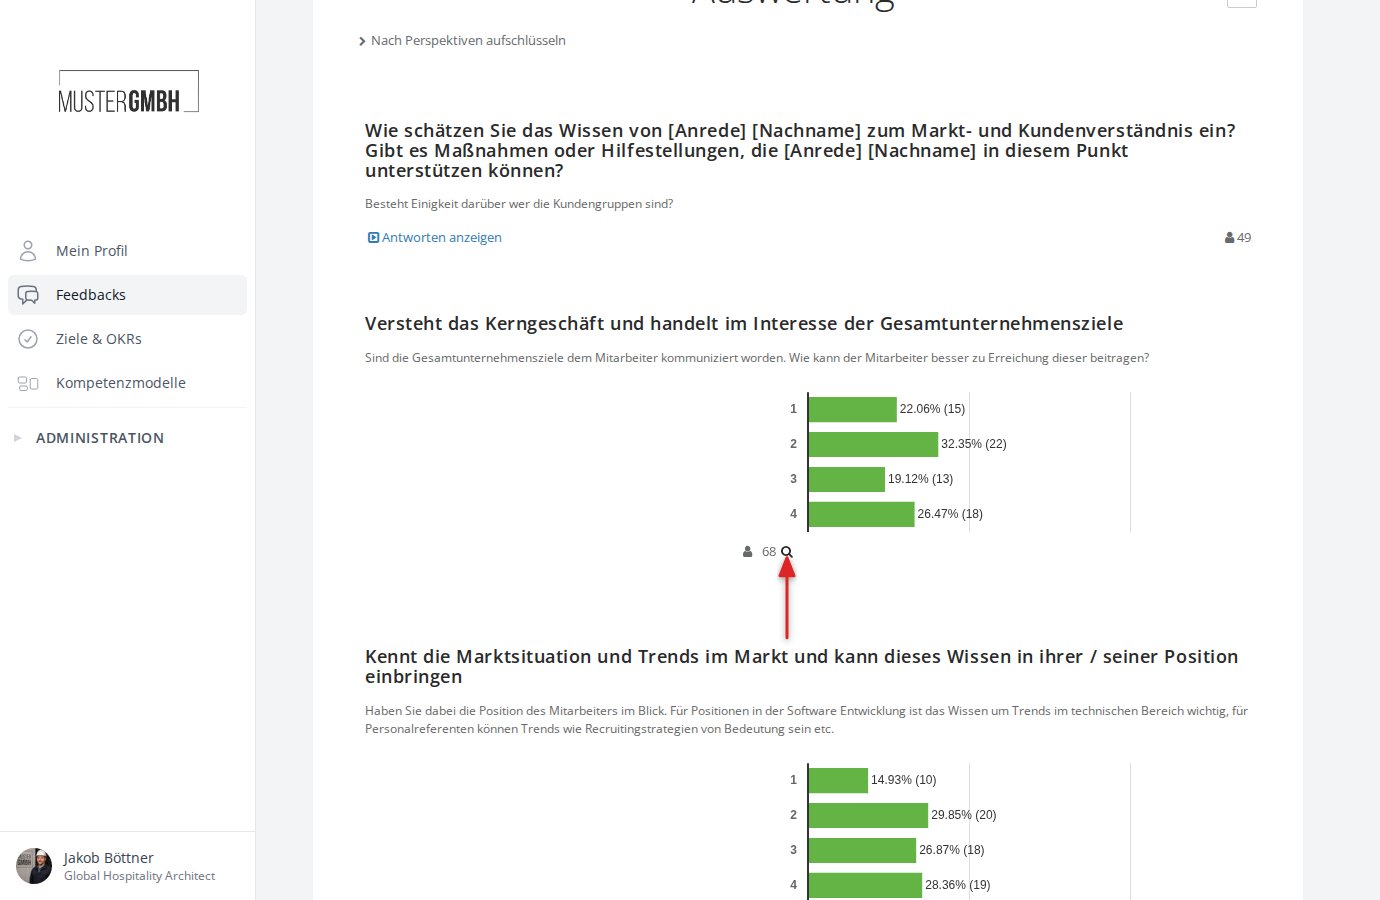
For non-anonymous reviews, a magnifying-glass icon appears next to the participant count. Click it to see in detail which people chose which answer option.
Rating questions
Rating questions are also shown as a bar chart. Here the answer options appear as star ratings instead of text or numbers.
Matrix questions
Matrix questions combine bar charts with a data table:
- One bar chart per row showing the distribution across the columns
- A table with percentage and absolute values per cell
- Average values per row
- Total number of participants per row
Break down by perspective
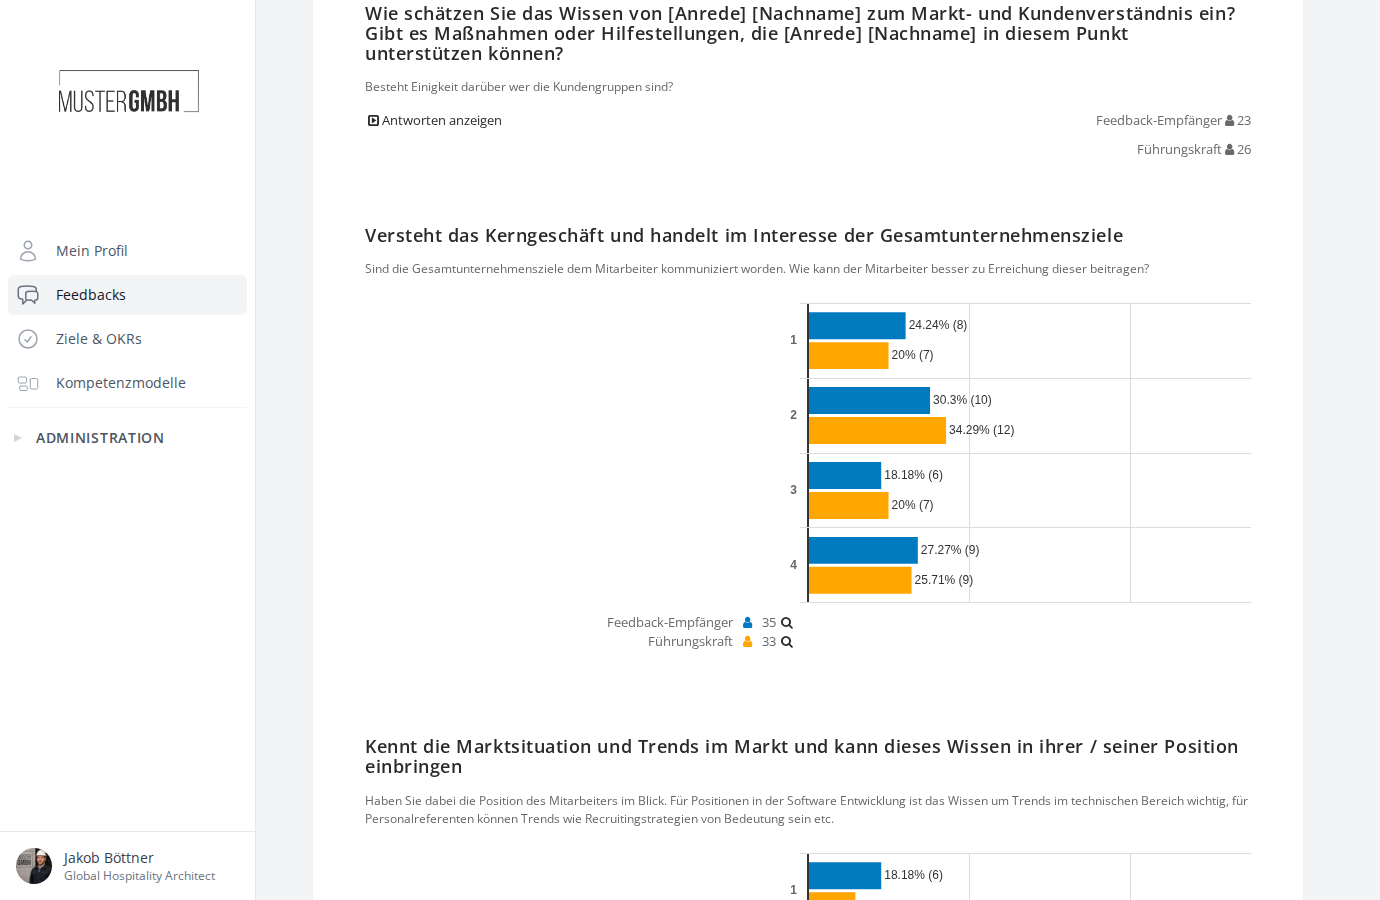
If your review has more than one perspective (for example, “feedback recipient” and “supervisor”), you can break the results down by perspective.
- Click “Break down by perspectives” below the “Evaluation” heading
- The bar charts now show a colour-coded bar per perspective for each answer option
- The participant count is also shown per perspective
To undo the breakdown, click “Break down by perspectives” again to collapse it.
Drill-down analysis
The drill-down analysis lets you break the results down by custom fields, for example by department, location, or other employee attributes.
- Click the three-dot menu at the top right
- Choose “Drill-down analysis”
- Select the evaluation dimension you want from the dropdown
- Click “Show”
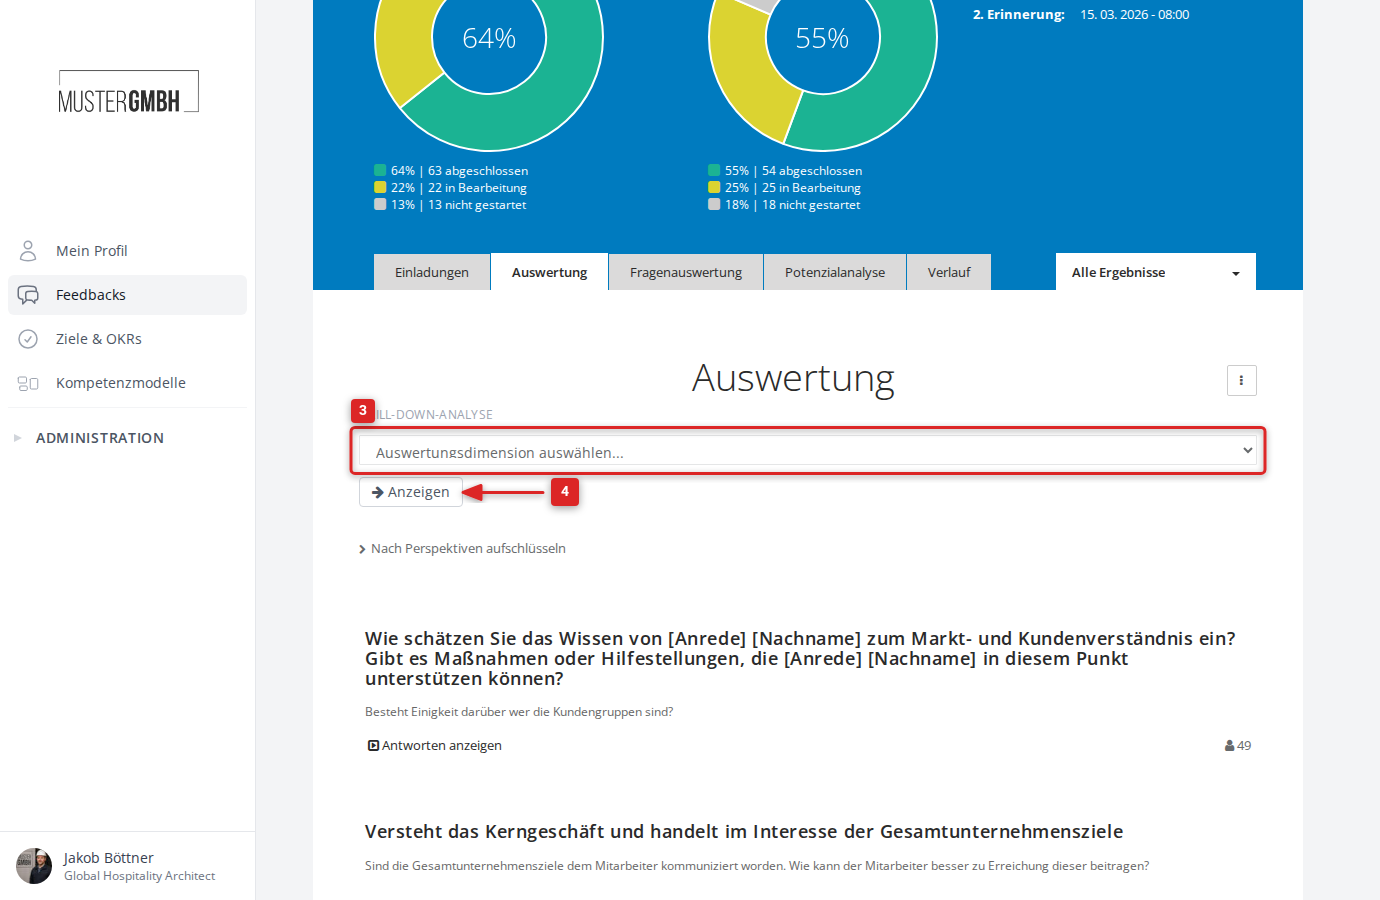
The results are then grouped by each value of the chosen dimension. This lets you compare, for example, how different departments answered a question.
For new dashboards, see Analyze one question: answers, strength values, and text and Filter, compare, and drill down.
Anonymity threshold
For anonymous reviews, easyreview protects participants’ anonymity through a minimum number of finalized feedbacks. By default, at least 5 feedbacks must be finalized before the evaluation is shown.
If there are not yet enough results, a notice appears instead: “Not enough results available. To preserve anonymity, at least X finalized feedbacks are required.”