Analyze one question
Want to know how your team answered a specific question? Choose One question in the wizard. A response distribution shows the full picture, while a metric summarizes it. Open questions have a readable text list.
How are the responses distributed?
Choose Response distribution, then your question, such as “Reliably follows through on agreements”. Each bar shows how often a response value was selected. This helps you see whether responses are spread out or concentrated around a few values.
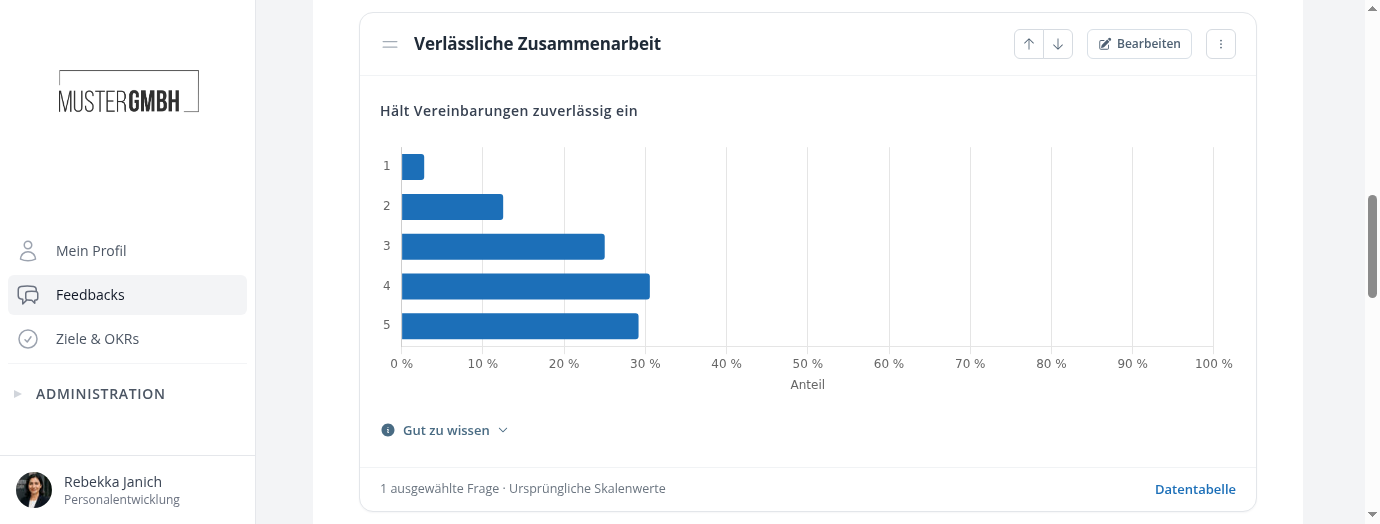
Under Values, choose Count or Percentage. Percentages help compare departments of different sizes. Bars, columns, and a table are different views of the same distribution. 100% shows stacked percentages where the question type supports it.
With multiple selection, one participation can contribute several answers. Percentages may therefore add up to more than 100%. Use separate bars or the table for these questions.
When is a metric useful?
Rating metric can show the mean of a scale question. Under Displayed metric, you can instead choose the median, standard deviation, minimum, or maximum, for example.
Strength score metric and Strength score distribution use the points assigned in the questionnaire. These may differ from the visible response values. “Strongly agree” might be worth ten strength points, for example. These analyses require configured strength scores.
A single average does not show whether everyone answered similarly. For important questions, combine it with a response distribution.
What do different perspectives say?
Rating comparison by perspective places self-assessment, managers, and peers on the same scale. To examine several questions together, use a comparison across multiple questions.
Agreement on ratings is particularly useful when several people rate the same person within a perspective. It shows how much those ratings vary. It does not tell you how many people agree with a statement.
Read open responses
Choose Text responses. Responses start collapsed to keep the dashboard manageable. Expand the list to read them. Use Search response texts in the settings to limit the selection to a search term.
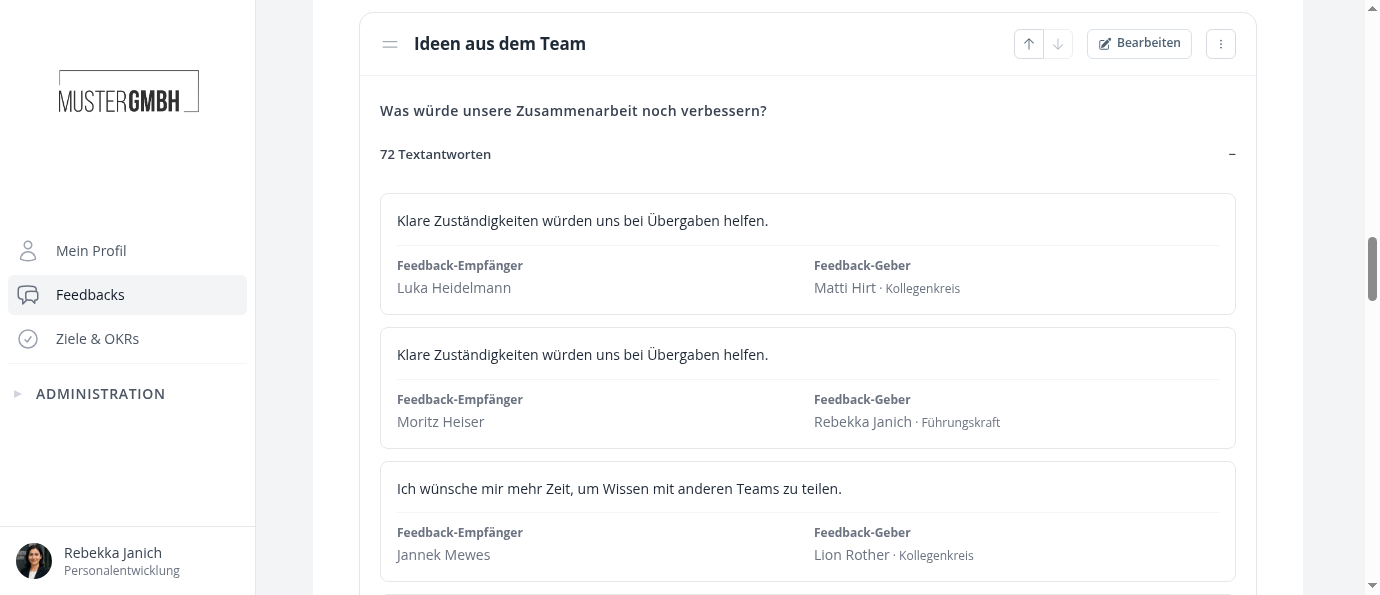
Feedback recipients’ and providers’ names appear only where the settings and your permissions allow it. Depending on anonymization, you may see perspective names or no personal information instead. A missing name is therefore not necessarily an error.
Matrix, grid, or trend?
For a matrix question, use Row or subfield to select a particular row. Grid cell frequencies is for grid questions: it retains the question’s two-dimensional grid and shows frequencies in its cells.
For repeated surveys, choose Ratings over time or Response distribution over time and select the rounds. To break a question down by department, use a dedicated drill-down element.