Compare questions and perspectives
Under Multiple questions, you can find patterns beyond a single response. A question comparison shows which topics receive higher or lower ratings. A perspective profile or heatmap also shows where self-assessment and manager ratings differ, for example.
Which questions stand out?
Choose Rating comparison across questions and select at least two questions. The combined display shows the selected metric, such as the mean, for each question. Use Highest values first or Lowest values first to find topics that need attention.
To examine points assigned in the questionnaire, choose Strength score comparison across questions instead.
Where do the perspectives differ?
A Perspective heatmap of ratings puts questions in rows and perspectives in columns. Each cell contains the average and the number of contributing people. Read across a row to compare perspectives on the same question.
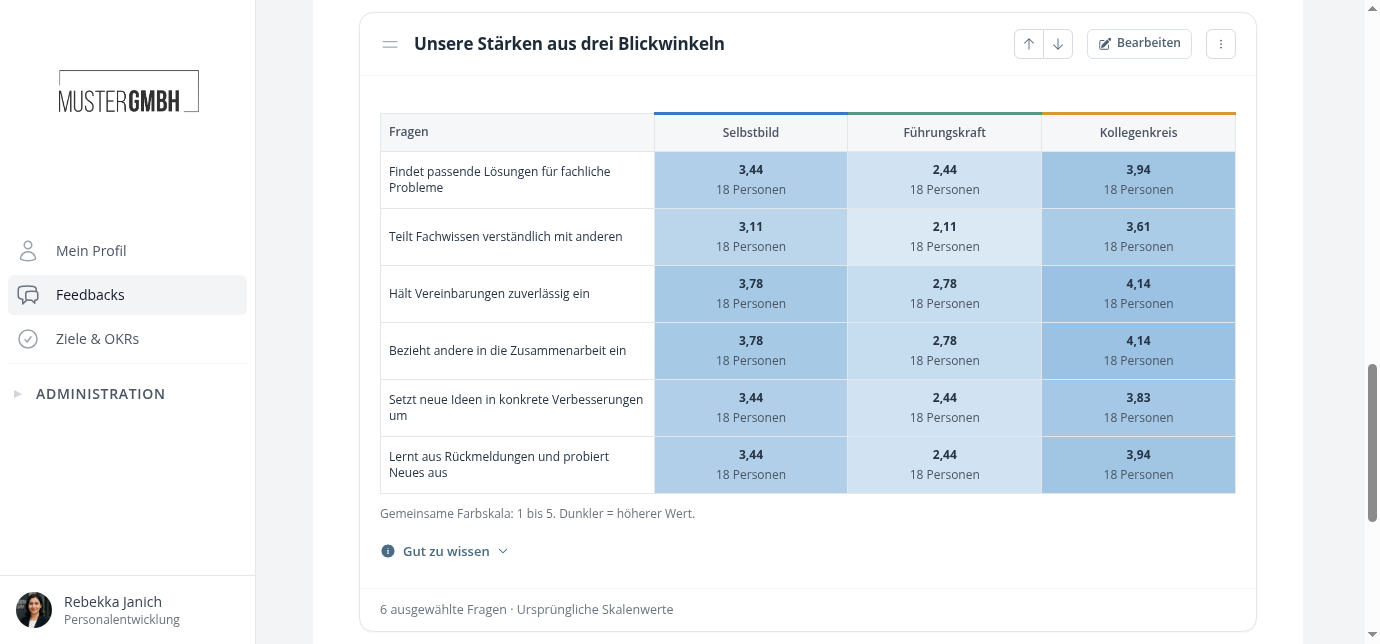
Color helps you find patterns. Darker simply means a higher value on the stated scale. Whether that is desirable depends on the question.
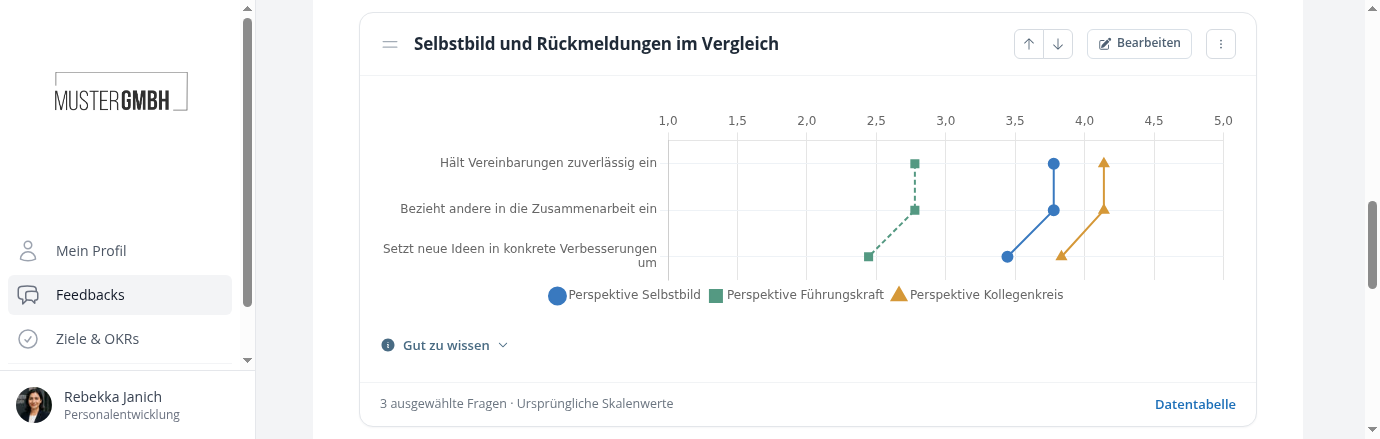
Rating profiles by perspective shows values as points on the same scale. With multiple questions, lines connect the points for each perspective. You can see, for example, whether self-assessment is consistently higher than manager ratings across several topics.
Highlight differences explicitly
In a perspective comparison, enable Highlight differences and choose a reference perspective. Compare it with a second perspective or a combined value from other perspectives.
The heatmap offers Difference from self-assessment. A value of −1.2 means this perspective rates the question an average of 1.2 points below self-assessment. Orange means lower, blue means higher. Zero means the same average, not identical individual answers.
Use these differences as starting points for a feedback conversation. They do not explain why the perspectives differ.
Compare questions with different scales
An average of 4 on a five-point scale cannot be compared directly with 7 on a ten-point scale. Under Scale comparison, you can convert suitable scales to 0–100. The endpoints of each scale must be known.
This conversion describes a position on the scale. A value of 80 does not mean “80 percent of people agree”. Alternatively, use a table to show the original values without placing them on a shared chart axis.
Combine questions into one value
Index based on ratings or Index based on strength scores combines your selection into a dashboard index. Every question has equal weight. Only people with a valid value for every selected question are included.
This index is a separate measure for your selected questions. For the configured overall questionnaire strength or weighted competency categories, use the people overview.
Where there are several raters, Agreement across questions can also help: low variation means similar ratings of the same person within one perspective. See Understand dashboard results for more context.